15 People Analytics Metrics for Better Managing Your Sales Function
How to use people analytics metrics to better understand how the sales function impacts the business. Are you tracking these 15 sales function metrics?
![[BLOG] 15 people analytics metrics for better managing your sales function](https://images.ctfassets.net/lbgy40h4xfb7/1VKwG7NZ70rMkgAAcbejD9/75706562f6f52c7d202c712d7d1cef59/02.05_15-Metrics-HEADER.jpg?w=1200&h=700&fl=progressive&q=90&fm=jpg)
Organizations have been using people metrics to track key HR measures like turnover rates, time-to-hire, and absenteeism for years. Now, though, data-minded companies are applying the same people metrics outside of HR and marrying them with business metrics, as a means to understand how people impact business outcomes such as customer satisfaction or sales revenue. In other words, it’s possible—and highly beneficial—to use people analytics to understand how actions taken by individual employees or entire divisions, like the sales function, impact the business.
The importance of sales function metrics
The sales function is an obvious place where people analytics can be applied to improve business results. Why? The more sales closed the more revenue companies bank, and the more efficiently those sales can be produced, the more ROI companies will realize. Several metrics can be used to boost those outcomes.
Metrics to measure sales rep performance
This set of metrics tracks the impact of an individual sales rep's tenure, resignation, and compensation compared to the amount of sales revenue they are bringing in.
1 & 2: Sales quota attainment & Return on compensation

The sales quota attainment metric measures the percentage of salespeople who meet or exceed their sales quotas. It’s a crucial metric for sales forecasting, helping sales managers predict sales and budget impacts. It provides insights into the effectiveness of the sales team and can be used to identify areas for improvement in sales strategies while observing trends over time.
Comparing sales quota attainment to the return on compensation metric can help sales managers set realistic (and challenging) sales quota goals. The return on compensation metric also helps companies determine how efficient their investment in sales team compensation is, measuring revenue generated in relation to budget spent on sales compensation.
3: Sales rep performance (high, low performer) vs tenure

Your high performers are the employees who just keep on giving. They meet their goals, and then some! The ability to accurately identify—or even predict—who these employees are holds clear benefits for organizations of all kinds. That’s especially true for sales organizations where the efforts of high performers directly impact the bottom line. Taking a look at high/low performance relative to other attributes of employees, like tenure, can yield additional useful insights. For instance, is there a point of diminishing returns where sales reps’ performance starts to slow or decline? Is there a point where leaps in performance are made after a new rep comes on board?
4: Revenue per full-time equivalent (FTE), or Revenue generated per sales rep
This practical productivity metric tracks the amount of money generated by an individual worker, in this case, a salesperson. Understanding this can help compare the effectiveness of the sales team, providing an opportunity to identify high performers and leverage best practices or to recognize where coaching and training might be needed.
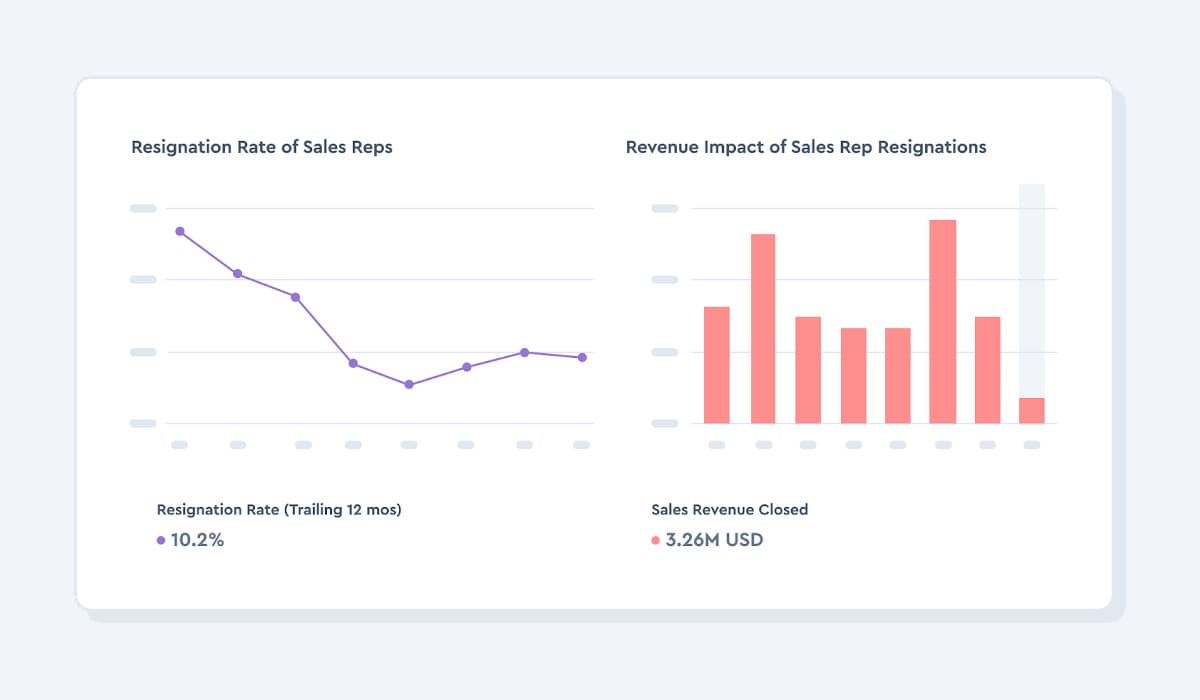
5 & 6: Resignation rate of sales reps & Revenue impact of sales rep resignations

Sales is a tough profession with high demands and, sometimes, low returns. Salespeople need to be tenacious and have the kind of attitude that helps them overcome obstacles and excel. But sales turnover can be high, especially in B2B positions. Tracking the resignation rate of sales reps metric can help you monitor and stay on top of resignation rates so you can quickly do interventions or course corrections to keep salespeople—especially your high performers—on board.
Losing a sales rep will impact revenue. But, by how much? The revenue impact of sales rep resignations metric can help you discover the revenue impact of sales rep resignations by considering such factors as the loss of direct revenue, the costs associated with recruiting and training new salespeople, declines in productivity, and the potential loss of business opportunities. Understanding the financial implications of sales team attrition will help you identify strategies to retain top sales talent.
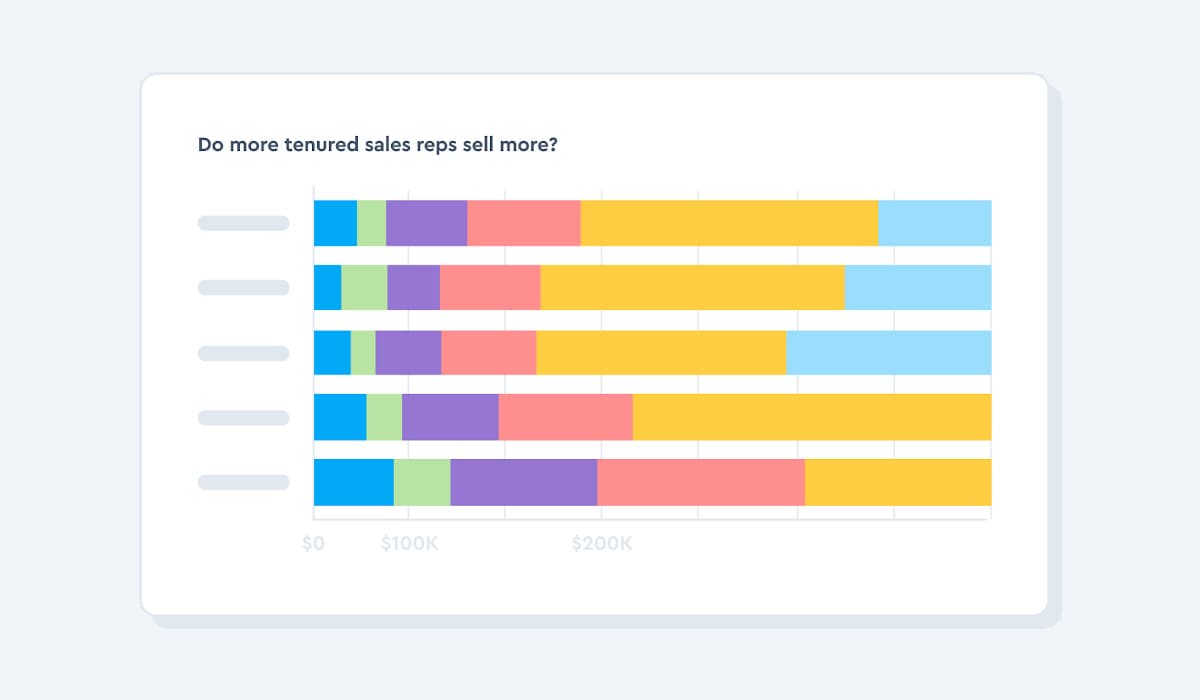
7: Tenure of sales reps vs. sales volume

Do more tenured sales reps sell more? Tracking this metric can help you answer that question and also identify points along the way where sales tend to ebb or flow depending on reps’ length of service. While you might assume that the longer the tenure of a sales rep, the greater their sales, that’s not necessarily the case. Whether that’s true will also vary by organization so it’s important to monitor both your people and your business data.

Metrics to track the efficacy of hiring & sales team structure
This next set of metrics takes a deep dive into how the sales function is put together and managed through hiring, onboarding, time to productivity, and spans and layers.
8: Quality of hire
The better the new member of your sales team, the greater the positive impact of their output will be. Quality of sales hires directly impacts revenue. Hiring high performers into revenue-generating positions, such as sales, can have a more direct, measurable, and immediate impact on revenue. As Dr. John Sullivan points out in an article for ERE, considering performance differentials can help companies boost productivity and business impact. “A performance differential is the quantified percentage difference on the job between an average and a top-performing hire (in the same job),” he explains. Quality of hire is a metric that can help companies maximize the impact of their sales team.
9: Time to productivity
In addition to evaluating the quality of hires, it’s important to know how quickly sales staff get up to speed and reach their full potential. Time to productivity evaluates this, offering a metric to help assess the effectiveness of onboarding and training programs.
10: Span of control
Does it matter whether a sales manager is responsible for 10 or 100 salespeople? Yes, it does. Managers may intuitively know this, but people analytics can be used to determine the sweet spot for span of control—the number of employees that a manager can effectively oversee.
Visier worked with a multinational science and technology company with 60,000 employees to help them determine the ideal sales team size. Not surprisingly, they found that less is more—smaller teams performed better than the global benchmark of 8-10 employees per manager. Determining the optimum span of control for your sales team can help optimize team structure and improve overall sales performance.

Metrics to understand how learning and development affect sales teams
Training is important for bringing new hires up to speed on the products and services they will be selling and learning the company's value props, while ongoing development helps to keep the sales function up to date on any new information helpful to their role. Understanding how L&D programs impact sales is possible with people analytics and is useful for optimizing how and where training is supplied.
11: Learning completions vs. sales quota attainment

Sales training is important, but not all training is equally impactful. This metric measures whether certain types of training have an impact on increasing sales quota (or not), helping companies identify opportunities to better target their training efforts, and to know what is working so they can replicate the process.
12: Cost of learning sessions
Training can be expensive and it’s important for organizations to understand exactly how much they’re investing in training by applying learning analytics. This metric considers all expenses associated with training or other learning, including material, facilities, and personnel. Gathering this data and combining it with other metrics—like learning completion vs. sales quota attainment—can help companies optimize their training and development budgets vs. business outcomes.

Metrics to evaluate and optimize the sales function
These last three metrics take into account the sales function's performance as a whole—how long does it take to close a sale for new customers and for existing ones through upsell or cross-sell, and what is the customer retention rate, often a litmus for post-sales success that sales teams can influence positively or negatively. When looked at over time sales leaders can identify patterns and trends, drilling down into specific locations, time periods, teams, or individuals to optimize their tactics for improved success.
13: Sales cycle length
How long it takes to close a sale can provide insights into productivity, the current market, and even how disparate teams or individuals may differ from one another. Logically, more expensive items will take longer and less expensive items take less time to close, but there is a range of time frames between the two extremes. This metric measures the average amount of time it takes for a salesperson to close a deal, from the initial contact to the final sale. It can be used to identify inefficiencies in the sales process and to develop strategies for shortening the sales cycle, thereby increasing the number of deals closed in a given period.
14: Upsell and cross-sell rate
As any great salesperson knows, the initial sale is just a starting point. Once on board, customers represent an opportunity to add revenue through additional sales. Understanding which sales reps are most and least successful at this can help identify opportunities for additional training in upselling and cross-selling best practices. When looked at through a different lens, this metric can reveal which products are moving well and which are not—valuable insights for R&D and Product Development teams, as well as for sales leaders to understand where their teams’ time is best spent to result in the largest sales.
15: Customer retention rate
Another important sales metric is customer retention rate. Gaining new customers can be expensive; losing them is a waste of resources. A high customer retention rate indicates strong customer relationships and post-sale service. This metric can help identify successful sales and service strategies so they can be replicated. When placed alongside other metrics such as the amount of customer help tickets closed or upsell rates, these combined metrics can tell a larger story about the impact of services or products on customer retention.
Without the appropriate metrics to measure the effectiveness of your sales function, chances are good that you’re not making the best decisions about hiring, onboarding, training, coaching, and gleaning best practices from high performers—and that lower performers may be draining your sales productivity, efficiency, and outcomes. Visier can help you gain visibility in all of these crucial decisions and provide the people data insights to truly impact your business's bottom line.


