Improve Your Company Culture Using Data
HR needs fact-based evidence to measure company culture analytics and build the solutions to maximize it. Use these 4 steps to get started.

Peter Drucker, the legendary management consultant, once famously said, “Culture eats strategy for breakfast.”
What is culture though exactly? It has many different definitions based on who you ask, but the value in making it part of your strategy and decision-making is undeniable. According to Culture IQ:
94% of executives and 88% of employees believe a distinct workplace culture is important to business success.
Employees’ overall ratings of their company’s qualities — like collaboration, work environment, and mission and value alignment — are 20% higher at companies with strong cultures. These qualities help winning cultures keep employees aligned and motivated.
13 companies that have appeared on Fortune’s annual
100 Best Companies to Work For
list every year also see higher average annual returns, with cumulative returns as high as 495% instead of 170% (Russel 3000) and 156% (S&P 500).
Companies with strong cultures saw a 4x increase in revenue growth.
Being named a
Best Place to Work
is associated with a .75% stock jump.
People analytics is a must-have in every organization, and it is increasingly being used to measure and understand the abstract concept of culture: What levers in the employee lifecycle improve our productivity levels? How do we prioritize the feedback from our engagement surveys? What do we need to do to tangibly demonstrate the impact of culture on our revenue?
The answers to these strategic business questions can’t be found by using intuition or hallway conversations. HR needs fact-based evidence to accurately measure measure organizational culture culture and build the right solutions to maximize it.
Case Study 1: Commute Times
In an interview with ic4p, Genentech, a global biotechnology organization, shared how they used attrition data paired with people analytics to understand which employees were at risk at their organization. They found that many employees were significantly more likely to resign based on whether they commuted to work. Genentech is located in the San Francisco Bay Area, a region that has experienced booming economic growth and, as a result, a crowded infrastructure that put a strain on employee commute times.
By using attrition data, they found that commute time doubled within the last 15 years. Employees were categorized into one-way commute increments of 15 minutes (i.e. 0-15 minutes, 16-30 minutes, etc). The HR team discovered that employees who had one-way commutes of 45-minutes or more had higher turnover rates.
In order to increase the retention of these employees, one solution Genentech came up with was to introduce working from home as an option.
Case Study 2: Smarter Headcount Reduction
Navigating a reduction in workforce is a tricky and sensitive process. The use of people analytics in reducing headcount can provide HR managers with the data necessary to make the most informed and beneficial decision for the organization.
For one particular financial service provider (FSP), having an analytics-driven strategy has proven incredibly successful. The FSP found that a certain area of their business wasn’t seeing as much revenue as it had in the past and they didn’t expect it to ever bounce back to previous revenue levels.
Their Finance department said they needed to reduce headcount to make up for the loss in revenue. After exploring the data with people analytics, HR came back with evidence and projections showing layoffs weren’t necessary after all, as voluntary turnover (including retirement and resignations) would get them to Finance’s headcount target without having to let anybody go; they just needed to wait for the data projections to run their natural course.
The data proved true—natural turnover brought them to their target only one month over the Finance department’s goal. The FSP’s HR team demonstrated through analytics that natural turnover would achieve the same goal with a lot less risk, loss of talent, less reputational damage, and less cost.
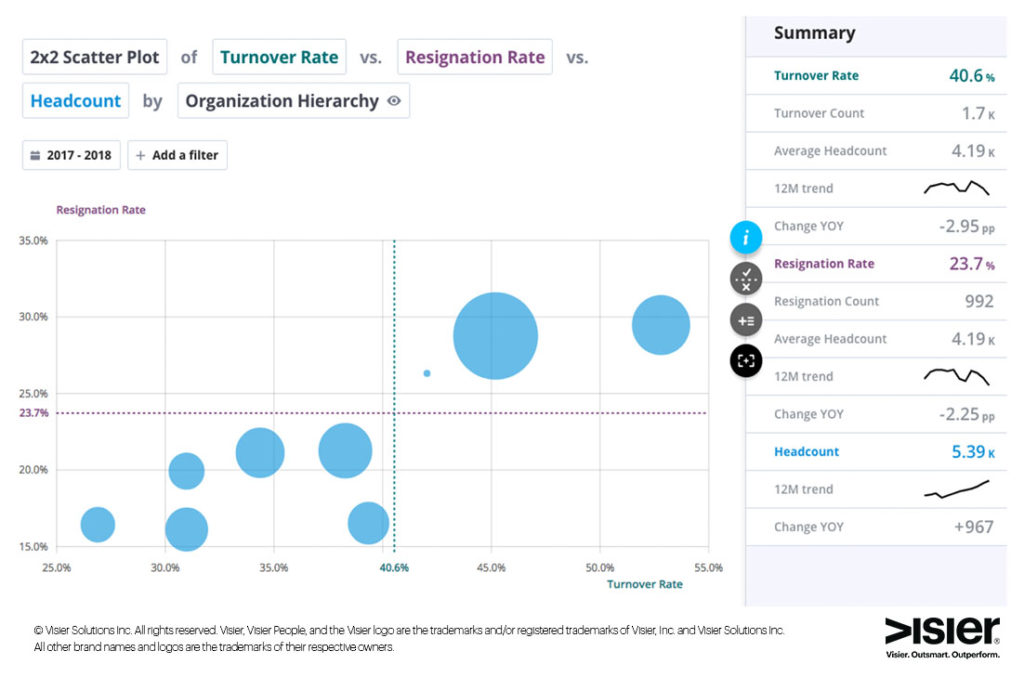
Data visualization of a 2×2 scatterplot showing turnover rate versus resignation rate versus headcount by organizational hierarchy
Four Steps to Properly Measuring Organizational Culture
It is usually very reactive when a company decides they want to start measuring culture, but it’s vital to make the change towards becoming a proactive company that catches cultural issues before they arise. The four steps below are your starter kit to properly measure organizational culture:
Step 1: Ask the right business questions
In this article, HR management consultant, David Creelman, describes why it’s important to always start with the business issue rather than focusing on finding HR answers:
Here is how this model usually plays out: An HR professional is given a report, usually data drawn from the HRIS, and is asked to look at the data, derive an insight, then tell a story. Normally, HR professionals find this very hard to do, not because they lack the right competencies, but because it’s genuinely difficult to find legitimate insights in rows of numbers and figures. Even if you were a data scientist with lots of data, tools, and time, it would be a challenge to find insights that would have an impact.
The secret to success is this: The story lies in the business issue, not in the data.
So when beginning your investigation into organizational culture, first ask yourself what the business cares about in relation to this area: Are you trying to attract more sales talent? Does the business need to save money? Is talent retention going to drive financial performance this year?
Step 2: Look for patterns and contradictions to find areas to focus on
Once you’ve identified the issue, use people analytics to further narrow your focus to where the population has the highest impact on this particular business outcome or company goal. When performing your analysis, remember not to report solely on single metrics as these won’t tell the whole story. Look for the trends, connections, and contradictions between your different data points.
Find out how promotions are affected by things such as compensation ratio, pay increases, tenure, performance, and training opportunities. This insight supports better decisions around changes to pay, benefits, and learning and development in order to manage costs while keeping employee engagement from falling.
Step 3: Identify solutions
Let’s say your organizational culture has been impacted by an employee turnover problem. Supplement the data you currently have by sending out different types of employee surveys in order to gather more intel on why people are leaving. Combine this qualitative information with your other metrics in order to find the right solution that will positively impact and change turnover.
Another way to identify a solution is to use Organizational Network Analysis (ONA), which enables you to discover helpful insights on employees with strong influences within the organization. Sometimes when a well-connected employee leaves, it can cause a ripple effect that leads to turnover contagion within the organization.
To find out how your connected employees may influence each other, look at these four areas:
Centrality: How many connections does the employee have?
Influence: How much effect does the employee exert over the network?
Diversity: How different are the people this employee is connected to?
Criticality: Is this employee a critically important member of the network?
Step 4: Build the right story using data journalism
In order to drive support for your solution, you need to present more than just a lot of good numbers to your C-suite and other stakeholders. You need to make the data actionable. A key part of this involves helping busy managers and C-suite leaders quickly understand the meaning and value of the insights being provided.
With the right data visualizations, key insights revealing cause-and-effect relationships can be woven into narratives that are accessible to non-technical audiences. Data journalism, the resulting union of data and visualizations, creates a memorable story that appeals to both our logical brain functions and our primal need for storytelling, helping unseat even our deepest-held assumptions about why things happen so can move past status quo and take action.
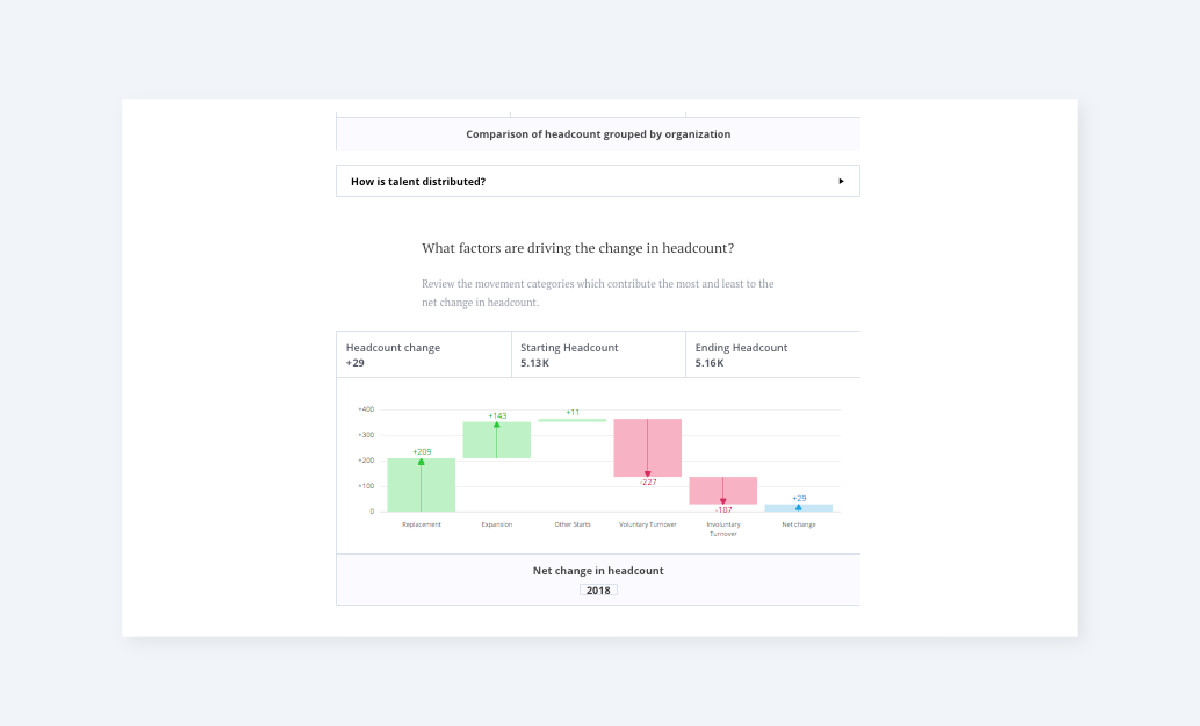
Data visualization showing what factors are driving the change in headcount
Embedding Data into Your Culture
The actions, behaviors, and tangibles that make up your employees’ experience will ultimately determine whether your workforce stays engaged and stays at your organization. If you’re not already measuring your company culture, start today by asking those inside and outside HR what the business issues are. The more data you gather, the brighter the future of your organization.
