Top Talent Acquisition Metrics Your Software Should Offer
Talent acquisition analytics make it possible to see key metrics in context, rather than isolation. Learn how to embed analytics into your software, and the benefits for your customers.

Talent acquisition (TA) is driven by human connection—and it will remain a people-first field. But in today’s data-driven, software-enabled mode of working, it’s become smarter and more strategic than ever before.
Budgets have never been tighter, and labor is among any organization’s greatest costs. As much as 28% of a company’s expenses, on average, are human resources (HR)-related.
TA and HR professionals need to deliver a return on those dollars. They must be able to prove that every decision they make is supporting business goals—from diversity, equity and inclusion (DEI) to boosting the bottom line.
Most talent acquisition software already collects this critical information, and hiring teams can’t afford to ignore it. But data reporting and analytics are the only way to take it from raw data to actionable meaning.
That’s why tracking talent acquisition metrics is critical to helping TA teams keep up in our new business landscape. A great software tool doesn’t just help you work faster—it helps you make stronger decisions and act strategically.
7 metrics every TA software tool should track
These key metrics analyze your candidate pool, what sources they’re coming from, and how they’re moving through your pipeline. That creates visibility, so you can make informed choices.
Is your recruiting strategy supporting business goals and needs?
What problem areas can you address?
Time to fill
How long is it taking you to fill open roles? This metric tracks the average number of days between posting a job, and your chosen candidate accepting an offer.
While the average time to fill is 42 days, a “good” time to fill metric will vary greatly by industry and how specialized the open role is.

But no matter what, it’s crucial to track this and establish a baseline. Open roles are expensive, so you want to do everything in your power to find a candidate quickly.
Cost per hire
How much are you spending on recruitment—and how many employees is that investment bringing in? These costs could include advertising the role, paying a recruiting agency, the interview and assessment process, training, and relocation.
This metric divides the total amount spent on hiring in a year, divided by the number of people you hired. It’s often calculated annually, but can also be broken down further, such as quarterly or by department.
Obviously, spending less on hiring is a good thing. But just like with minimizing time to hire, you do need to invest in making sure the candidate is the right fit.
Time to hire
Rather than tracking the time it takes to fill a role, this metric tracks how quickly candidates move through the hiring process. How many days pass, on average, between submitting an application and accepting an offer?
While a short time to hire is generally good, that shouldn’t come at the cost of finding a great candidate. Multiple interviews, trial projects, and background checks are all steps that could slow your time to hire down, but could help ensure you’ve found the right fit.
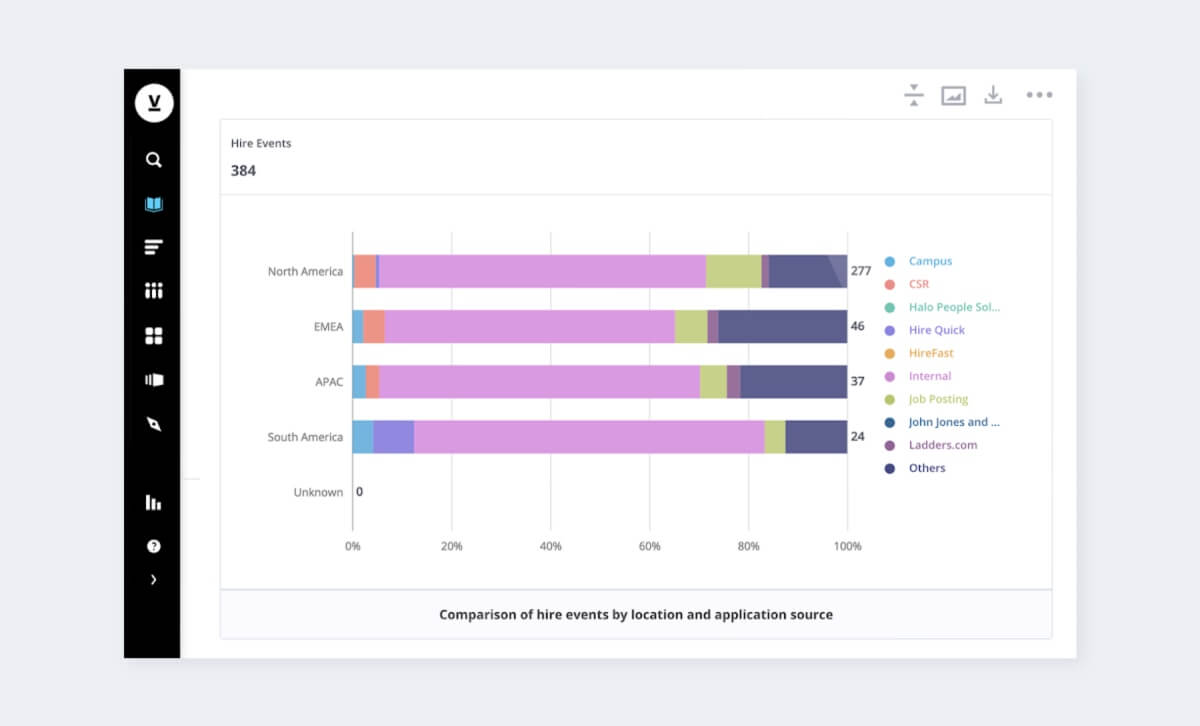
Source of hire
Which sources of applications are bringing you the most candidates? This metric shows what percentage of your total hires came from different channels, like social media, job boards, and your own careers page.

This metric is crucial to understanding which sources of applicants you should be focusing on. To get better ROI, you’ll double down on the most productive sources, and de-emphasize those that result in fewer applications.
Sourcing channel effectiveness
This metric is a good way to evaluate the quality, rather than quantity, of applications coming from each source. It’s typically found by dividing the number of applications received from each channel by the number that became hires.
Say 25 of your hires came from LinkedIn as the result of 2,000 applications. Meanwhile, only 10 people applied through your Careers page, but you hired 4 of them. The Careers page would actually be a more effective channel.
Candidate diversity
Without this metric, there’s no way to track progress towards diversity, equity, and inclusion. Which demographics are well-represented, and which will you need to work harder to attract?

You can also compare candidate diversity to employee diversity. If your workforce is much less diverse than your applicant pool, you may need to investigate why candidates from under-represented groups aren’t receiving or accepting offers.
Offer acceptance rate
Once you’ve found great candidates, how often are they accepting your offer?
This metric is an important way to assess if you’re making competitive offers. That includes benefits, and perks like flexible work in addition to salary. Strong employer branding can also help you present your organization as a great place to work.
Generally, you should aim for an acceptance rate above 90%. Since you spent all that time finding the right person, you want it to pay off!
Go beyond basic reporting with talent acquisition analytics
The key metrics above will be useful no matter what. But to truly see the big picture—and plan for the future—you’ll need advanced analytics.
Talent acquisition analytics help you see these metrics in context, rather than isolation. Comparing them to one another, or slicing by different timeframes and candidate groups, allows you to see your talent pipeline as it changes dynamically over time.
That’s a powerful way to gain deeper understanding and make meaningful progress towards important goals. A sophisticated TA analytics tool will allow you to:
Track trends in key metrics over time, or at a specific point in time.
How did things shift in relation to big changes or decisions at your organization?
Compare metrics to each other.
How are different demographics compensated at your organization?
How do your workforces’ salaries compare to industry benchmarks?
Slice metrics by different time periods, like weekly or quarterly.
Do you want a real-time, or big-picture view of metrics like cost per hire or candidate diversity?
Segment key metrics by groups to understand what experience you’re offering for different employee or candidate demographics.
Are women, or younger candidates, taking longer to move through the hiring process?
Visier Embedded Analytics for talent acquisition
Recruiters and HR professionals know they can’t ignore the answers within their data. Visier Embedded Analytics lets you bring them that ability within your product—a tool they already know and trust.
Analytics is our core competency. Rather than spending years and thousands of dollars attempting to build your own solution, Visier Embedded Analytics lets you add best-in-class capability to your product—seamlessly customized with your own logos, branding, and text. Choose from data enrichment APIs to end to end embedded applications. Get a demo today and learn how you can make analytics smart, yet simple for your customers.
Learn more about pre-built embedded analytics tools:
How Predictive People Analytics Helps Businesses of All Sizes Thrive
How Embedded Analytics Work: Embedding Visier into Your Product
On the Outsmart blog, we write about workforce-related topics like what makes a good manager, how to reduce employee turnover, and reskilling employees. We also report on trending topics like ESG and EU CSRD requirements and preparing for a recession, and advise on HR best practices how to create a strategic compensation strategy, metrics every CHRO should track, and connecting people data to business data. But if you really want to know the bread and butter of Visier, read our post about the benefits of people analytics.


