Five Awesome Recruitment Metrics for Tech Innovation Success
Tracking recruitment success to drive tech innovation - Here are five recruitment metrics that will help you efficiently land quality talent.

It takes a bit more than a ping-pong table to attract and retain a group of in-demand software engineers who regularly delight new and existing customers with innovative products.
When it comes to coders and developers, competition for talent is truly global (you can speak the language of Python in any country), and getting more fierce by the minute. In fact, the demand for software developers in the U.S. is set to grow 22% faster than average, according to O*NET.
To recruit and engage the high-potential people who will deliver innovative products or go above and beyond for your customers, it’s important to track two things:
Recruitment optimization
Tracking recruitment success to drive tech innovation
Too often, recruitment success is purely gauged by time-to-fill quotas or cost-of-hire numbers. All these numbers do is tell organizations how quickly someone was hired at the lowest possible price. An overfocus on these metrics leads to hiring that is faster, cheaper…and (from a talent quality perspective) typically worse.
Here are five key metrics to focus on to more efficiently hire more top performers:
1. Qualified applicants-per-requisition
Why you need it:
The qualified applicants-per-requisition metric indicates whether your sourcing practices are delivering what you want: people who can do the job effectively.
How to get it:
Start at the end of the period you want to analyze.
Count all of the qualified applicants you have for the requisitions — that are still open or were closed — during the period.
Count the number of requisitions that are still open or were closed during the period.
Finally, divide the number of qualified applicants by the number of open requisitions to calculate your metric.
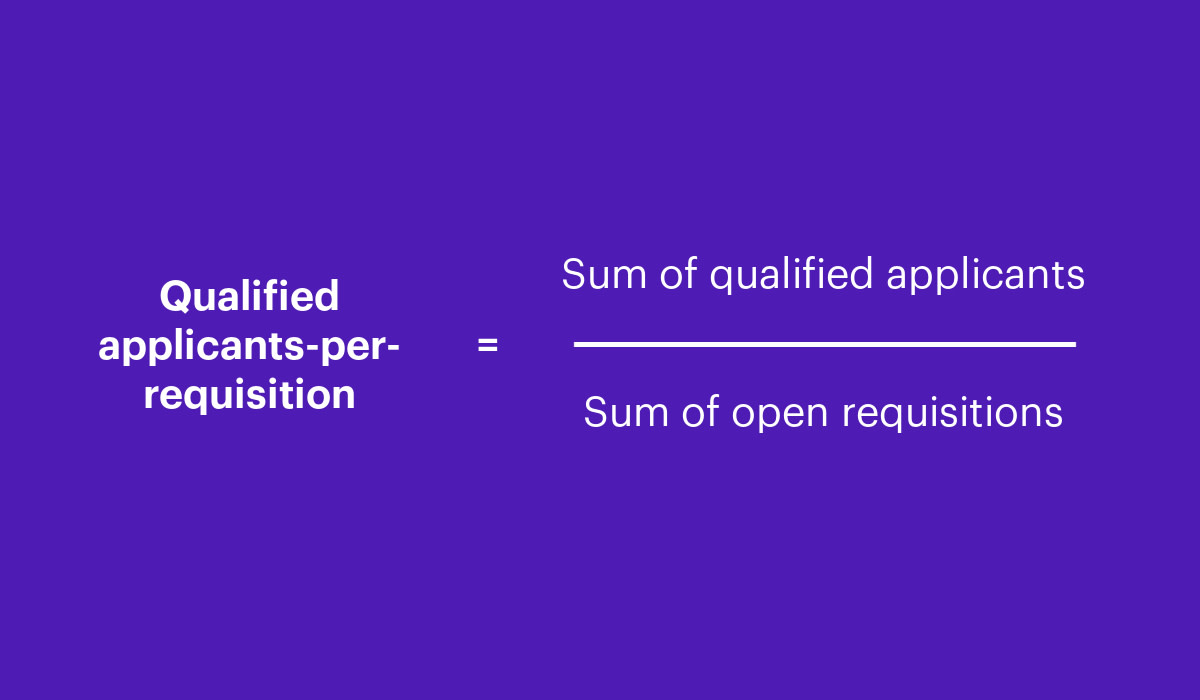
You can further refine your numbers by looking independently at the requisitions that are closed and the requisitions that are still open. This will help you determine whether specific roles or geographies are seeing more or fewer qualified applicants-per-requisition.
Red flags to act on:
If you see that your qualified applicants-per-requisition metric is declining over time, then you need to tweak your sourcing activities. For example, you may need to post job openings in new locations or revamp your referral program.
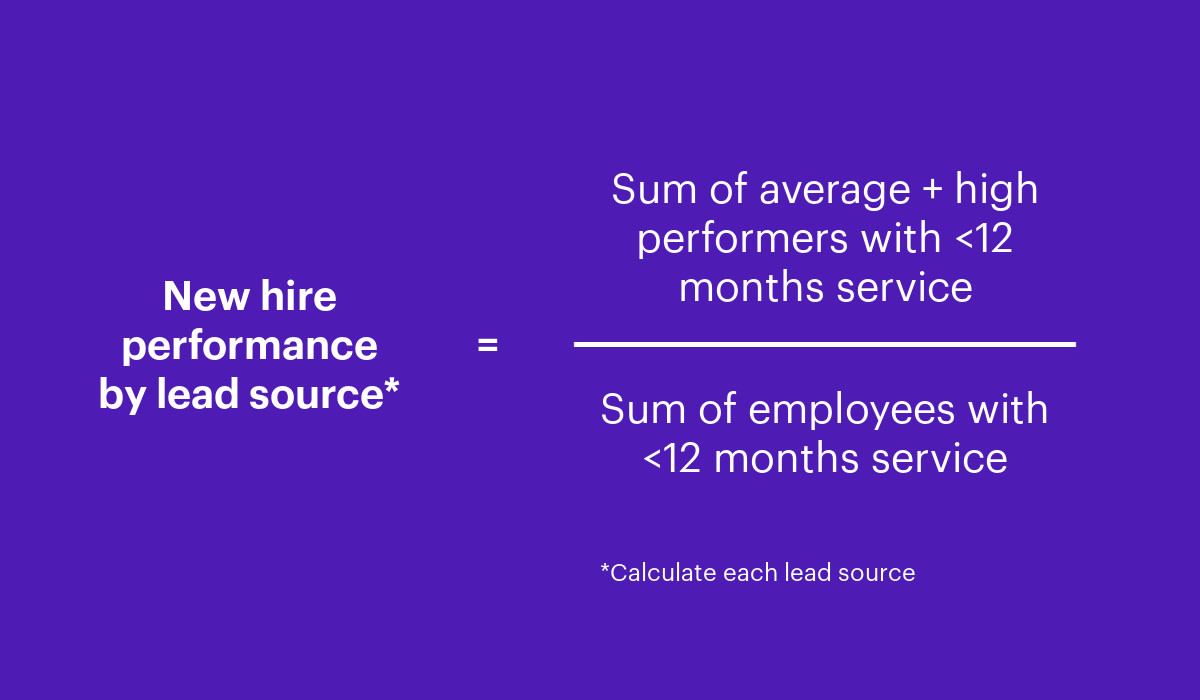
2. New hire performance by lead source
Why you need it:
This metric tells you not only whether your new employees are getting up to speed effectively, but by referencing lead source, it enables you to cycle back into your recruiting efforts so that you know where your best people come from. This allows you to consistently fine-tune and improve your sourcing and selection efforts to build overall quality of talent in the organization.
How to get it:
Record the source of the application for successful candidates as part of their employee record.
Count the total number of people with less than 12 months of service. (These people should be grouped by the last performance rating they received. They should also be grouped by the hiring lead source through which they came to the organization.)
Of this group, count the number of people who are not considered low performers.
(Performance scales vary, so low performance needs to be defined by the organization. For example, on a traditional 5 point performance scale, scores 1 and 2 are considered low performance.)
Divide the number of people who are not low performers by the total number of people from steps 1 and 2 above.
Red flags to act on:
The primary goal of every recruiting function should be to improve the quality of talent in the organization, while managing the price that is paid for this talent. New hire performance is something that needs to be tracked over time and action needs to be taken when the trend turns negative. For example, if your new hire performance starts to drop, then you need to review your whole talent pipeline to determine whether candidate quality is dropping or whether onboarding and ramp-up processes are not delivering like they should. That’s why this metric is so valuable: it reveals what is really impacting overall talent quality.
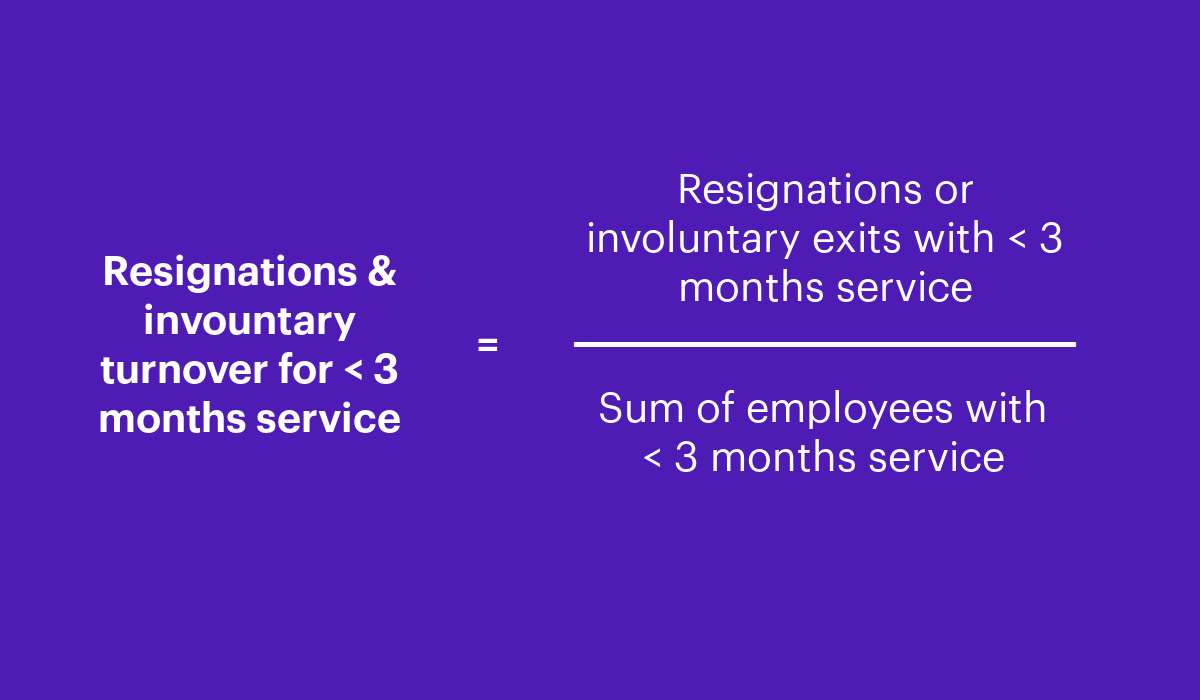
3. Resignations and involuntary turnover for less than three months service
Why you need it:
If someone leaves your organization within 90 days of starting, then you most likely have no return on the time and money you invested in finding, onboarding, and training them to do the work required. The combination of the resignation metric with the involuntary turnover metric tells you whether you are landing the right people or not.
How to get it:
Select the time period you want to analyze.
Count all the people who have less than three months service at the beginning and end of your analysis period (this allows you to calculate average headcount).
Count all the people who left and had less than three months service during the period.
Categorize and group these exits as resignations or involuntary.
Divide the number of resignations or involuntary exits by the average headcount of people with less than three months service.
Red flags to act on:
If an increasing number of people are resigning within three months of starting, then this is a bad sign that the role or culture or something else about the organization was a significant mismatch – this should have been caught through the hiring process. It also could be a sign that expectations about work performance were not properly communicated.
If an increasing number of people are being asked to leave within three months of starting, then the hiring team may not be picking up on critical red flags about capabilities or fit.
Calculate this metric by department, location, or manager to better pinpoint problem areas.
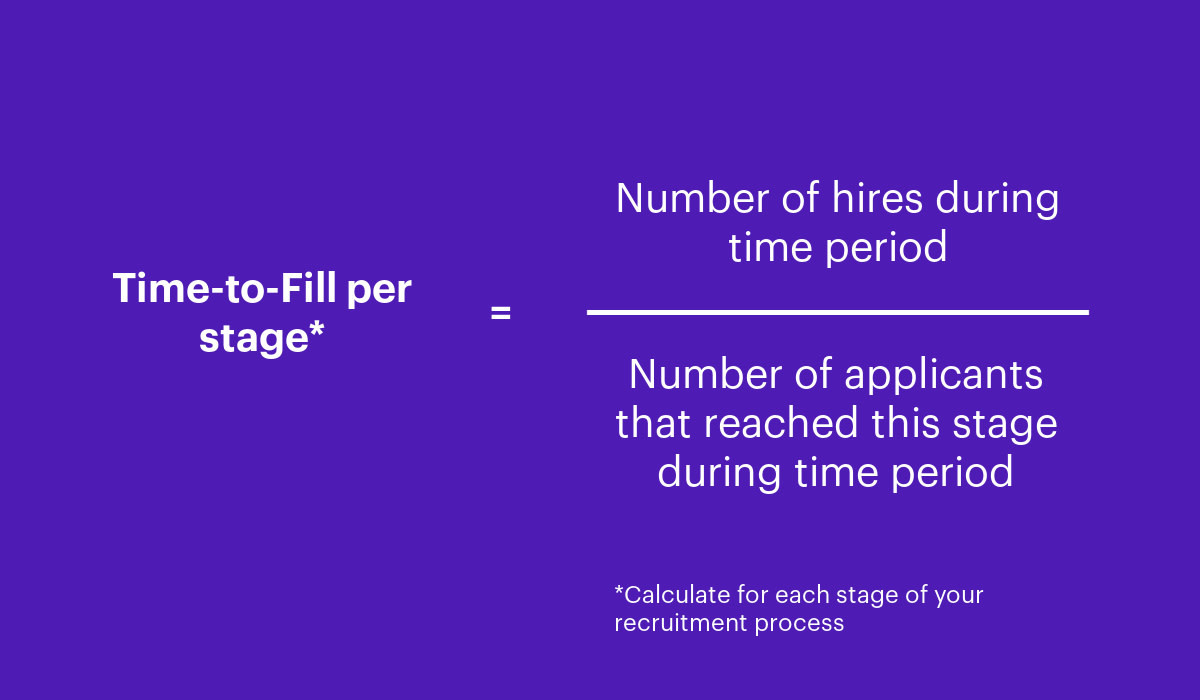
4. Time-to-fill by recruitment phase
Why you need it:
The variation in how long it takes you to fill a position will tell you how efficiently you are sourcing candidates. However, the recruitment process can stall out at multiple points, and as mentioned earlier, an over-focus on this metric can diminish the quality of new hires. It’s important to complement the general time to fill metric with a more granular view of bottlenecks. This requires HR to dig deeper into the data and review conversion rates at each stage in the process — from applications received to offers extended — to pinpoint where the problem exists.
How to get it:
To understand your bottlenecks, follow these steps:
Determine the stages on your hiring pipeline (typical stages are applications, screening, interviewing, etc.).
Identify the number of applications that reach each stage.
Calculate how long it takes for an application to move between stages.
Calculate your total time-to-fill
Red flags to act on:
Once you understand your recruitment pipeline, you will be able to pinpoint stages where inefficiencies are hindering your hiring efforts. For example, if it takes more than five business days for a candidate to receive an offer, the candidate is less likely to say yes. Or if it takes a long time to move through from application to interview, a lot of the most promising candidates will no longer be available.
5. Top talent characteristics
Why you need it:
Technically, this is not a metric, but rather a way of looking at the workforce data to determine the characteristics of a top performer, which then allows you to uncover who from the candidate pool shares those characteristics. For example, a large manufacturer used this type of analysis to discover why some of its hires from top schools succeed while others fail. The company learned that its most successful MBA recruits had all worked earlier in their careers in fast food or held some other low-wage service job. They then changed the candidate selection criteria to reflect these findings.
How to get it:
To identify top talent characteristics, follow these steps:
Define top talent in your organization (e.g. top box performance for at least three consecutive years).
Form top talent cohorts for different job families and roles inside the organization – specifically those you are hiring for or where talent quality has most impact.
Run an algorithm to identify the most significant characteristics. (With advanced “in-memory” applications running specifically tailored algorithms, this information is far quicker and easier to generate and can be used to identify people from the application pool who share the relevant characteristics. However, if you don’t yet have access to technology like this, you can manually calculate this with some elbow grease…)
Process applications to identify those with relevant characteristics.
Focus your hiring process on landing these candidates.
Red flags to act on:
One of the potential problems with the approach is that what defines top talent can change and it is not always clear when this happens, so it is not enough to run this process once and keep a “static” view of what defines top talent. The process needs to be continuous and updated regularly.
Bringing all the recruitment data together
Rarely in the dynamic environment of talent and people does one metric tell the whole story. With the above approaches, you will be properly informed about the effectiveness of your hiring processes, enabling you to find the right people who will help you create a competitive advantage.
Once you have landed talented people, how do you keep them and ensure they continue to perform? Stay tuned for an in-depth look at the relationship between manager effectiveness and performance.
