What is HR Analytics and Why Should I Use Them?
HR analytics helps businesses collect and analyze HR data, and make informed decisions to improve business outcomes. Learn more.

The way we do business is changing every day. Not too long ago, companies only cared about their employees’ skills. Today, human resources is a central and crucial part of any organization. And employees are much more than a set of skills. HR analytics is a process of collecting and analyzing human resource data, with the goal of improving overall talent and business performance.
Used correctly, HR analytics can change the way human resource departments operate. It can create better dynamics within teams, improve employee engagement, and reduce turnover. Wondering how you can make it work for your organization? Then this guide is for you.
How does HR analytics work?
Correct and effective HR analytics requires going through a few steps that depend on one another. We call it an eight-step model for purposeful analytics and it includes:
Framing the business questions.Why are you undertaking this specific analytics exercise? What issues are you looking to solve? What is the business reason for this initiative?
Building the hypothesis. What do you think the underlying cause of the issue is? Where are the opportunities for improvement? Creating a strong hypothesis will help focus your data gathering and analysis activities, and will help link your findings back to your key business questions.
Gathering data. What data is most relevant to your hypothesis? Is the quality of that data reliable? Do you have enough existing data, or is new data required? To collect data, you can look at a wide variety of sources, such as HR information, learning and development systems, and other cloud-based sources like wearable and mobile devices. Data types should include performance, compensation, training, engagement, turnover, and absenteeism.
Conducting the analysis. Apply data and statistical analysis best practices to your data to test your hypotheses. The goal is to find patterns and insights that point to a specific problem or opportunity.
Revealing insights. Present your findings in a way that is easy to understand by all executives, project sponsors, and stakeholders.
Determining recommendations. Based on those insights, create a clear list of recommendations that will help the business improve. Present these to all executives, project sponsors, and stakeholders involved.
Getting your point across. Use storytelling, visualizations, and context to clearly articulate the importance of your findings and recommendations.
Implementing and evaluating. Determine what should be implemented, get buy-in from key decision makers, implement the agreed-upon changes, and track results over time.
What is HR analytics used for?
You can use HR analytics to improve several processes in your organization. You can make better business decisions, test the effectiveness of your procedures, and improve HR processes.
For example, you may find the time to hire is too long. Through analytics, you take a closer look at why this is.
Maybe you find the skill assessment process is the barrier. In that case, you can work with the team to see what can be done to make that assessment effective.
Or maybe you discover that the job application is the root cause of your problem. So you can work with the HR team to make the process simpler, and more accessible so that candidates can apply quickly.
5 ways to apply people analytics to your business
You know what HR analytics are and what they can do for your business. But how exactly should you use them? Here are five ways HR analytics can help improve your talent processes.
1. Retention
Voluntary employee turnover can be extremely costly. One or two people quitting without explanation once a year may be unavoidable. But when the turnover rate grows higher, it’s time to learn why.
How? Everything begins with data collection.
Gather data about past resignations. Look at employee behavior, engagement, and productivity. How long had they been in the organization when they decided to quit? Did they participate in any training? Did they have enough opportunities for growth?
The goal is to identify patterns in their behavior. These patterns can in turn help you predict when an employee is likely to resign.
2. Overall employee experience
Employee engagement, productivity, and attendance all make up the overall engagement of a person inside a company.
Earlier, we were talking about turnover rates. Maybe through your analysis, you discover that one of the causes is poor employee engagement. Or it might be that you also notice poor attendance and/or productivity.
Again, you’ll need to start gathering data. Even if only one of these areas is a problem, look at the other metrics as well. Then gather other people data such as salary, benefits, vacation time, and more.
You can’t motivate and improve employee experience if you don’t know what’s causing the problems in the first place. With the data at hand, you can begin comparing metrics and looking for patterns to find solutions for improvement.
3. Recruitment
When looking for a new candidate, you don’t just want someone with the right skills. You want someone who is aligned with the work culture and the business vision. And that may be hard to find.
It’s not that the right people don’t exist. But when you’re going through hundreds of applications, it’s easy to miss things.
To quickly reduce the pool size you may focus on things that are easy to scan in an application — like skills and experience — and ignore all the rest.
HR analytics can help you gain deeper insights into potential candidates. It can aid you in identifying all the attributes that matter to you.
A data-based approach to recruitment ensures equal opportunity for all your candidates. Analytics can also provide metrics that help you determine how long it takes to hire for a role. And from there you can determine how to improve the process.
4. Performance
Recruitment and other HR processes are usually measured through overall performance. When trying to improve performance, you’ll need to gather relevant data. What that means, depends on your business. But, in general, the usual people data can be applied: skills, benefits, vacation time, and more.
Again, you’re aiming to find a correlation between the data at hand and performance markers. Can you spot a pattern when the performance begins to drop? Or quite the opposite, maybe you notice things that help performance improve.
5. Training
Training is often crucial to a positive employee experience. Many people say they are more likely to stay with an organization that gives them opportunities for learning and development.
Metrics worth tracking include training efficiency or the necessary expenses per employee. Data collected should have information regarding performance, engagement, and overall user experience. The results should help you answer a few important questions, such as:
Is the training efficient?
Are people truly learning new skills?
Should you offer different types of training?
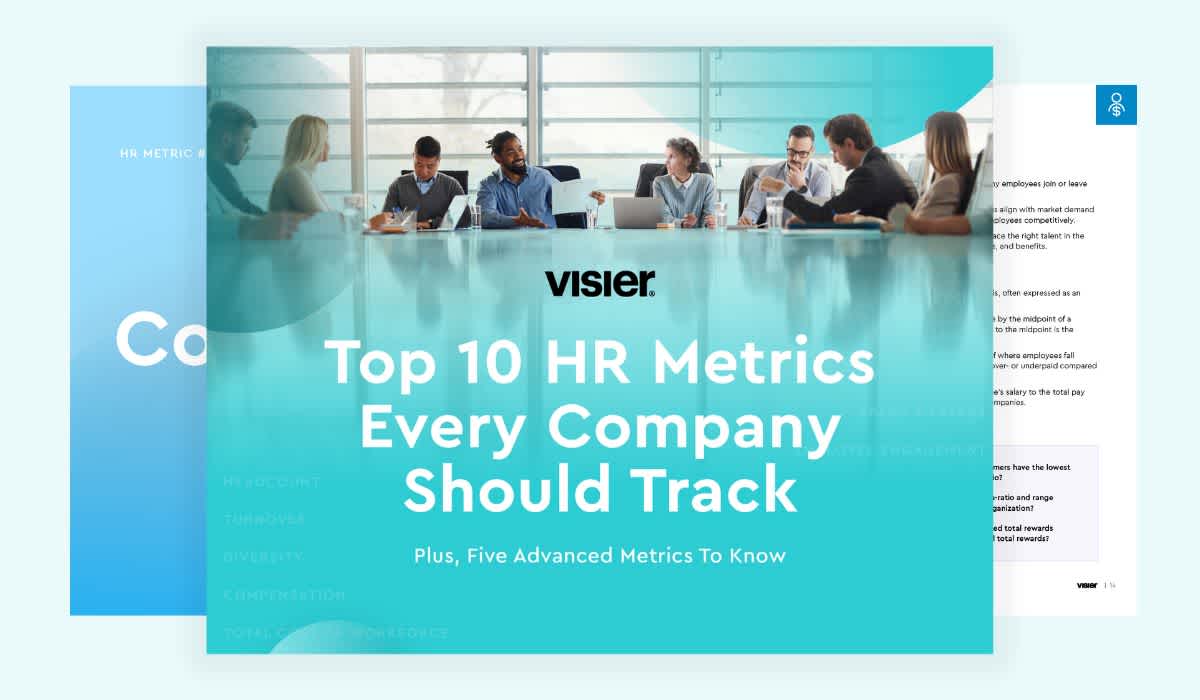
10 examples of HR analytics metrics
HR analytics comes in many forms, with many applications. Here are some examples of HR analytics metrics that you can track at your organization.
1. Recruitment cost to hire
This metric is tracked over time. The goal is to find the total costs needed to recruit and hire a new candidate. Depending on your business, you may also want to compare the costs to hire across different sectors.
2. Time to hire
This is another metric that is monitored over time. It allows you to see how long it takes to hire a person. The recruitment process can be very costly. Tracking time to hire can help you find solutions for making the process more efficient.
3. Offer acceptance rate
Divide the number of job offers made by the number of accepted offers during a certain period and you get your offer acceptance rate. This metric can give you insights into your talent acquisition strategy. Is the rate dropping significantly? It might be time to update your strategy.
4. Training expenses per employee
The total cost of training over the total number of employees who participate in the training will give you the expenses per employee. On its own, this metric won’t tell you much though. The real question is, are these costs worth it? So compare the numbers with that of sales, employee, and customer satisfaction.
5. Training efficiency
Training for the sake of training is not a sustainable strategy. Tracking this metric requires looking at each employee’s career path, productivity, employee engagement, and customer satisfaction.
6. Revenue per employee (RPE)
The RPE metric is made of the total revenue in a certain period over the total number of employees. Some prefer to also look at net revenue, subtracting expenses and expenditures.
7. Turnover
The rate at which people quit their job – the turnover – is a crucial metric. It can help you see practices that are going well vs those that aren’t. And it can help you improve business strategies. The involuntary turnover rate can also be tracked, though the voluntary numbers are usually considered the most important.
8. Absenteeism
This metric needs to be compared with the company’s goals and acceptable absenteeism rate. It can help you spot issues in employee satisfaction and engagement. Increased absenteeism rates could also turn out to be related to an increased turnover rate.
9. Human capital risk (HCR)
Do you have enough employees? Do they have all the necessary skills? Are there proper succession plans in place in case a key employee leaves? HCR is made of several other metrics such as turnover, absenteeism, training efficiency, and more.
10. Employee engagement
Engaged employees are more likely to stay with a company. They’re more productive and feel more satisfied with their work life. You need to measure things like employee productivity or performance. Through surveys, you can also determine their overall satisfaction with the job or the company.
HR analytics FAQ
What is HR analytics?
HR analytics is the collection, processing, and application of talent and human resources data with the goal of improving business outcomes and employee effectiveness. It refers to both the data collected and the processes employed to develop data-driven insights and strategies to inform strategic decisions about a workforce, improve HR processes, and create better employee experiences.
What can HR analytics be used for?
HR analytics can be used to boost employee retention, improve the overall employee experience, strengthen recruitment efforts and employee performance, and streamline training and development.
What does HR analytics include?
HR analytics includes the collection and analysis of HR data like:
Cost to hire
Time to hire
Offer acceptance rate
Training expenses per employee
Training efficiency
Revenue per employee
Turnover
Absenteeism
Human capital risk (HCR)
Employee engagement


