The Value of HR Analytics Tools: Key Features for 2024
HR analytics tools help companies collect, analyze, and glean insights from their HR data. Learn more about them here.
HR analytics is one of the best solutions if you want to understand your workforce, what motivates it, and how to get better results. The tools you use are often just as important as the data you collect for analysis. With dozens of HR analytics tools to choose from, it’s easy to lose track of the features that matter. Here’s how to make the best choice for your business.

Quick recap: what is HR analytics?
HR analytics means collecting and analyzing HR data. It allows HR teams to measure the progress of various initiatives, improving things like engagement, talent acquisition, retention, or productivity.
HR analytics helps you look beyond standalone metrics, showing you the “why” behind the numbers. You’ll be able to create better strategies to motivate your workforce, boost productivity, and attract the very best.
You’ll often hear of people analytics and workforce analytics, too. These are similar to HR analytics and often go hand in hand, but they have slightly different purposes.
Here’s the difference.
People analytics deals with all people-related data, as well as business data (like financial data and OKRs) and industry data. This can include both employees and candidates, former employees, and general market data.
Workforce analytics deals exclusively with workforce-related data. Unlike HR analytics, which can include data on time to hire, cost to hire, expenses, and more, workforce analytics works with data related to employees, freelancers, gig workers, or consultants.
Types of HR analytics
There are various types of HR analytics available. The best ones will depend on your goals. Let’s take a quick look at the 4 most common types.
Descriptive analytics. Do you want to gain insights into what has happened in the company? Descriptive analytics is the option you need. It is the most basic type of HR analytics, looking at historical data, and performing various mathematical calculations to help you understand past trends.
Diagnostic analytics. This takes descriptive analytics to the next level, helping you investigate the root cause of various events.
Predictive analytics. Are you trying to predict future trends? In this case, predictive analytics will be a good option. Using statistical analysis and machine learning algorithms, predictive HR analytics helps you find future trends, so you can always be one step ahead.
Prescriptive analytics. The most complex HR analytics type, prescriptive analytics, takes your predictions to the next level, recommending specific actions so that you can optimize processes and come to the desired outcome.
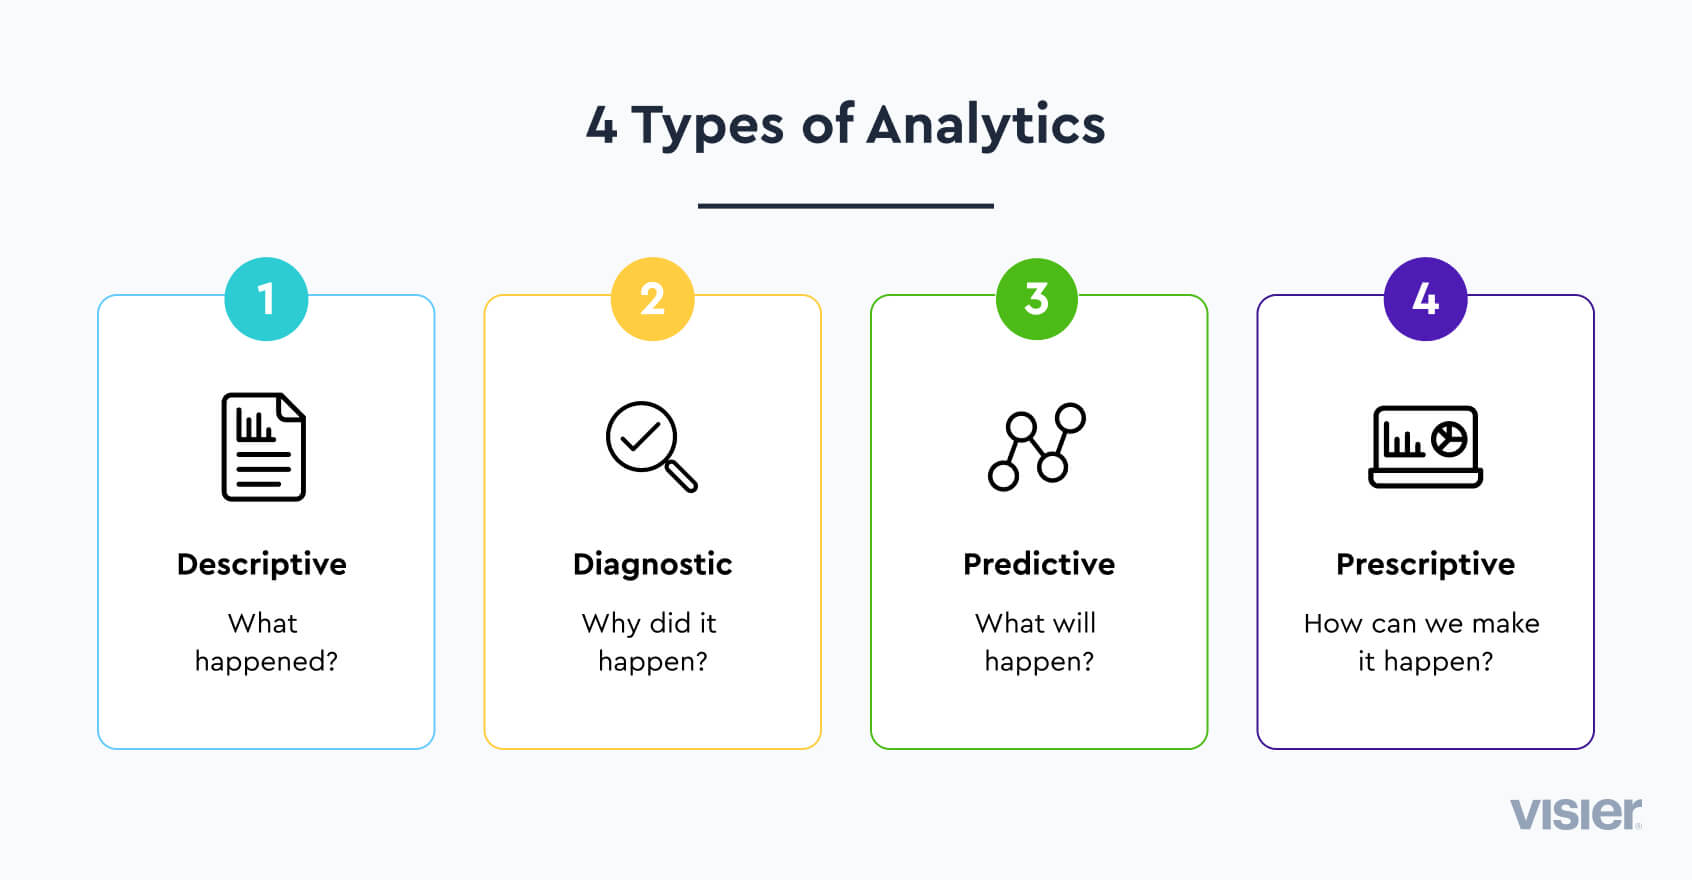
You can use one or more of these analytics types, depending on your goals. But because they are different and have different degrees of complexity, they will often need different tools. A tool that can help with descriptive analytics may not have the capabilities to perform prescriptive analytics, for instance.
What is an HR analytics tool?
An HR analytics tool collects, processes, and analyzes HR data, providing insights and helping you make data-informed decisions. Some may also offer features to visualize and report data, depending on their scope.
These tools are essential for the analytics process. Trying to perform HR analytics manually is almost always impossible and can lead to serious mistakes. A small company with one or two employees may be able to handle it. But anything beyond that will need HR analytics tools to get the correct results.
Types of HR analytics tools
There’s no shortage of HR analytics tools out there. And the good news is there’s something for every system, every budget, and every business goal.
1. Excel
It may sound shocking, but you can use Excel as an HR analytics tool. When you collect raw data from various sources, you’ll often get it in a CSV format. This is easy to use with Excel where you can check how clean your data is or perform basic transformations. You can also use this tool to visualize your data with basic graphs and create reports.
Excel won’t be the best choice for more complex types of analytics like prescriptive or predictive, but can be a great tool if you want to look at historical data to gain some insights.
It is also perfect for those who have a low budget as most companies will have Excel and employees who know how to use it, so the investment will be minimal.
2. R and Python programming languages
R is a programming language and not an HR analytics tool per se, but it's one of the most commonly used analytics solutions. It’s a powerful statistical computing environment that you can use for data analysis, statistics, and data visualization.
When used correctly, it can help with the most common types of HR analytics, from descriptive to prescriptive. It’s open source, so there’s no need to purchase any software.
The downside is that it has a steep learning curve. You’ll need to understand programming concepts, statistical methods, and data manipulation. Most HR professionals will probably need additional training before using R, so consider that when making your choice.
Similar to R, Python is a programming language that you can use for data analysis. It has fewer functionalities than R, especially for statistical analysis. But it is easier to learn, so the time to train your team could be shorter.
3. HR analytics software
If you don’t want to do a lot of manual work or learn a programming language, you can choose one of the many analytics software available. These solutions can offer support for all types of analytics. They often collect and process data automatically, taking some of the tedious, repetitive work off of your hands.
Tools like Visier offer a complete solution for people analytics, workforce analytics, and much more. It has a short learning curve, so you’ll be ready to use it in no time.
Tableau is geared more towards data visualization, but you can also use it for data analytics. It has a steeper learning curve, but in comparison to programming languages like R and Python, it is easier to use. Or, you can use Tableau with HR analytics tools like Visier to have the best of both worlds.
4. HR analytics dashboards
Last, but not least, HR analytics dashboards are the perfect tools if you’re interested in data visualization. They allow you to record, evaluate, and report on various HR performance metrics.
Many of them are interactive, which makes them perfect for presenting data to stakeholders. You can focus on one or two metrics per dashboard, trying to dig deeper into what is happening and why. Or you can work with multiple metrics at the same time to gain a broader view of your data and your workforce.
Must-have features for an HR analytics tool
With dozens of options to choose from, finding the best analytics solution can seem challenging. Should you go with something open-source like R or Python? Should you choose a commercial software that is easier to learn and offers more facilities?
A lot depends on your business and your goals. Here are some things to consider before making your choice.
Data integration capabilities. Chances are you have data scattered across multiple silos. That’s why you need a tool that can aggregate data, process it, and analyze it with little effort.
Visualization and reporting. To gain valuable insights from your data analysis, you need a tool that allows you to visualize the results and create comprehensive reports.
Customization and flexibility. Each company is unique, so find a tool that you can easily customize to fit your specific requirements.
Collaboration and sharing features. HR analytics is not a one-person job, so your analytics tool shouldn’t be either. Ensure collaboration and sharing are easy so that people and teams can work together and create better outcomes.
Scalability. There’s no doubt the amount of data you have will grow in the future. If you want to make a long-term investment, choose a tool that can accommodate that growth without compromising efficiency.
Security and compliance. HR data is often personal and sensitive, so ensuring security and privacy should be a top priority. With privacy regulations becoming stricter and stricter worldwide, security and compliance are critical for any business.
User-friendly interface. Some companies, like those choosing to go with R or Python, may not consider this a must-have. And they would be right. However, a user-friendly interface ensures people have an easier time using the tool and can gain better insights into the data.
Depending on the type of analytics you’re interested in, make sure the tool you choose supports it. This is especially critical for those who want to use predictive or prescriptive analytics, as not all HR analytics solutions support them.

How Visier helps power your HR analytics
Visier is a complete analytics solution. Whether you want to focus on people analytics, workforce analytics, or predictive analytics, Visier has the right tools for you. Despite its wide variety of options, it is easy and intuitive to use, so you won’t have to waste time on endlessly training your employees.
With Visier, you can understand what’s going on with your employees, what drives them to perform their best, and how to retain top talent. You can also focus on things like talent acquisition or learning analytics, to create better processes that drive true productivity and performance.
Last, but not least, Visier offers data visualization options so that you can quickly gain insights and create the reports you need.
On the Outsmart blog, we write about workforce-related topics like what makes a good manager, how to reduce employee turnover, and reskilling employees. We also report on trending topics like ESG and EU CSRD requirements and preparing for a recession, and advise on HR best practices like how to create a strategic compensation strategy, metrics every CHRO should track, and connecting people data to business data. But if you really want to know the bread and butter of Visier, read our post about the benefits of people analytics.

