The Riveting Headcount Story That Can’t Be Ignored: Bringing HR Numbers to Life, Part 2
Visier's UX team provides a helpful step by step example of telling the story behind headcount change to avoid the headcount trap.

Picture this: You are the VP of Talent for the North American operations of Innovocorp — a (fictional) software company based in the Silicon Valley that is going through a period of dramatic change.

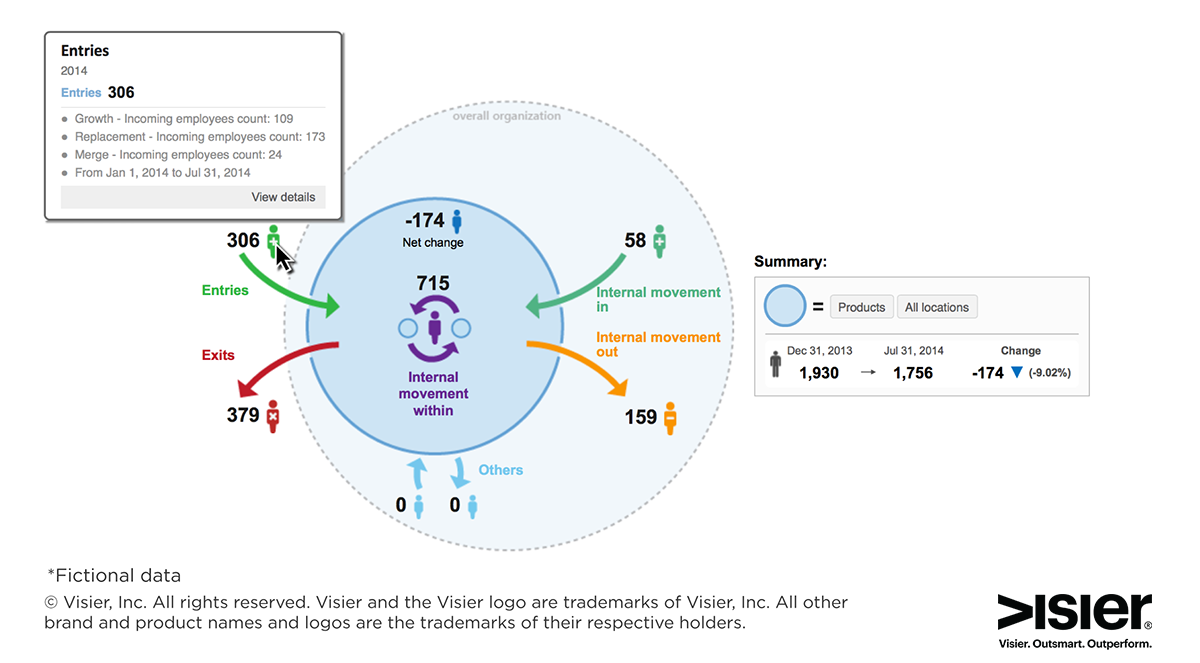
visier movement chart headcount
The company recently acquired ZippySoftCo to close gaps in its technology and accelerate its product roadmap. The company also re-organized its product development organization to incorporate a team of customer subject matter and usability experts alongside software developers, so that it can continue to innovate with new software releases that meet market demand.
But not everything is going as planned. Competitors are luring top engineering talent away faster than you can replace them, with attractive signing bonuses and career advancement opportunities, and you are concerned that your organization doesn’t have the bandwidth to meet the aggressive development demands of your CEO.
The problem is that the headcount data only shows an 11.6% net headcount change in the product development team — a number which looks healthy and does not instill a sense of urgency with your leadership team. What do you do?
The answer is to tell a story that brings the numbers to life. Memorable data-driven visuals can back up your argument and help you deliver a compelling, informed point of view that is typically lost in the details of data tables and executive presentations. Here is an example:
Our North American product development team is a fundamental driver of our business success.
Today, I will show you how a high employee movement rate is putting our ability to deliver new product releases at risk. We will also go through some key recommendations to address this in the future.
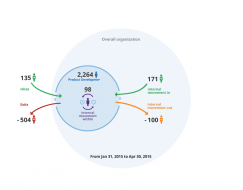
Over the past three months, the North American product development team has experienced a total of five major events.
#1: 98 team members moved into new positions within the group.
Visier Headcount Story
#2: 171 front end developers, subject matter and usability experts recently moved into our product development team from other parts of our organization in an effort to streamline our development process.
#3: At the same time, 100 employees moved out of product development in North America to work at our new office in France.
Visier Headount Story 2
#4: We also had to let 120 poor performing engineers go, and 384 engineers left due to voluntary turnover, resulting in 504 exits total.
#5: We also gained 135 new engineers due to our recruitment efforts. But this was not enough to make up for the shortfall created by regrettable turnover.
Visier Headcount Story 3
When all these different events are taken into account, we can see that a full 35.5% of the product development group is either missing, learning, or working under new management.
Visier Headcount Story 4
We cannot meet our aggressive development pipelines with this high level of churn.
Recommended actions are:
develop retention programs for high performing engineers
focus on training
review how relocation requests to France get approved to manage any overall negative impact
By focusing on the above actions, we can more realistically boost the productivity of our development team, helping us gain maximum returns from our recent acquisition investment.
As Ian Cook describes in this blog post, How to Avoid the Headcount Trap, it is very common to look at the net change in headcount for a given period of time, and then use the headcount metric as the basis for decisions around movement (for example, to decide how many people the organization should hire, transfer, promote, or layoff).
With this in mind, you can see how the “narrative” of movement gives organizations more effective understanding of how many people are new to their roles and the shortfalls in capacity due to ramp-up time. Ultimately, telling the right story with data-driven visuals helps communicate the overall impact of key metrics within any critical part of a business.


