Reports vs Analytics: What’s the Difference?
Businesses rely on analytics to make sound decisions, but the difference between reports and analytics can be confusing. Learn the differentiators between reports and analytics, and the unique outputs of each.

Businesses rely on analytics to make sound decisions, but the difference between reports and analytics can be confusing. Learn the differentiators between reports and analytics, and the unique outputs of each.
The way businesses operate has changed significantly, from how strategic decisions are made to the way work gets done. In today’s competitive business landscape, leaders are increasingly using analytics to find the answers they need to make decisions with greater confidence.
While the number of businesses opting for analytics is steadily increasing, the differences between reports and analytics can be confusing. Let’s explore what’s behind each!

What are analytics and how are they different from reports?
To put it simply, reports provide data and analytics deliver insight. This is true, but it's not really a helpful explanation if you don’t know the how or why behind it.
I've discovered there are layers to understanding the difference between reporting and analytics. The more technical you get, the more you can understand the true potential of analytics.
In this article, I'll focus on the differentiators between reports and analytics, and the unique outputs of each. In the next post, I’ll explain the technical differences that make it all possible.
Transactional and operational vs. insightful
The first significant difference between reports and analytics is the source of the data.
Your basic reports are run against the system in which the data was originally created, such as your HCM (Human Capital Management), Learning Management System (LMS), or Accounts Payable system. These systems are transactional—or operational. They're designed to help you efficiently perform certain tasks and keep records of those tasks. While these systems provide reporting options, it’s not their primary purpose.
Reports provide data. Analytics deliver insight.
Let's use hiring a new employee as an example. HR needs to create a record for that employee that captures their basic information, job title, and manager. This “hire” transaction—the creation of a core employee record—is performed in the HCMs. Once created, this record can be accessed in other areas of the HCM to perform new actions, such as benefits registration, IT provisioning, and payroll processing.
However, there’s no single record that includes every event or action for an employee—the system simply couldn’t operate if it had to access a giant file like this each and every time a user accessed an area of the system. Instead, the records of each transaction are split across the HCM and only the ones necessary are accessed—a pay record here, benefits there, and performance reviews elsewhere—each with a connection back to the core employee record, but not to each other.
Why? The technical structures underpinning transactional systems are designed to facilitate system performance so you can complete all of your actions quickly: searching up a record, making a change, and saving that change. However, this same structure also makes it difficult (if not impossible) to create reports that are sourcing data from different locations within the system.

Data is stored separately to specifically optimize performance. Bringing the data of every event or action from different tables together in a report can slow down the system, sometimes to the point of stalling it entirely. I’ve had to open many a support ticket to have a server restarted after an overly ambitious report caused it to grind to a halt.
This distributed storage approach also aligns with data privacy regulations like GDPR, as it helps limit access to sensitive employee data to only the systems or personnel authorized to process it. Compliance requirements mandate that transactional systems ensure robust access controls and data segmentation to minimize exposure. AI-driven analytics tools integrate privacy safeguards, such as automatic data anonymization or advanced access controls, to help your organization stay compliant.
Analytic solutions, meanwhile, are designed specifically to connect data from different records, transform and normalize it, and facilitate the exploration of that data. The restrictions and connections necessary in a transactional solution aren’t needed in an analytic solution. The data can be structured and organized to optimize analytics in real-time. Where your HCM solution can’t store a single thread of every event involving an employee, a well-designed people data platform can.
Data can be connected and joined to optimize retrieval, especially when coupled with a powerful query engine. For example, Visier’s can query source data can execute complex queries literally millions of times faster than a traditional database.
Static columns vs. dynamic definitions
Reports in your transactional system are defined before you run them, and these definitions include which data columns will be included in the report. You may have controls on your report that allow you to set parameters for the report results, such as date range or by organization, but you’re still limited to receiving just those columns in the report.

If you want different columns, you’ll need to run a different report or, if you have access to the report writing tool, you’ll need to write your own report and then run it.
On the other hand, analytics display results for the selected parameters in a visualization intended to illustrate patterns and trends, bringing insights to the forefront without you or your team having to do any of the heavy lifting.
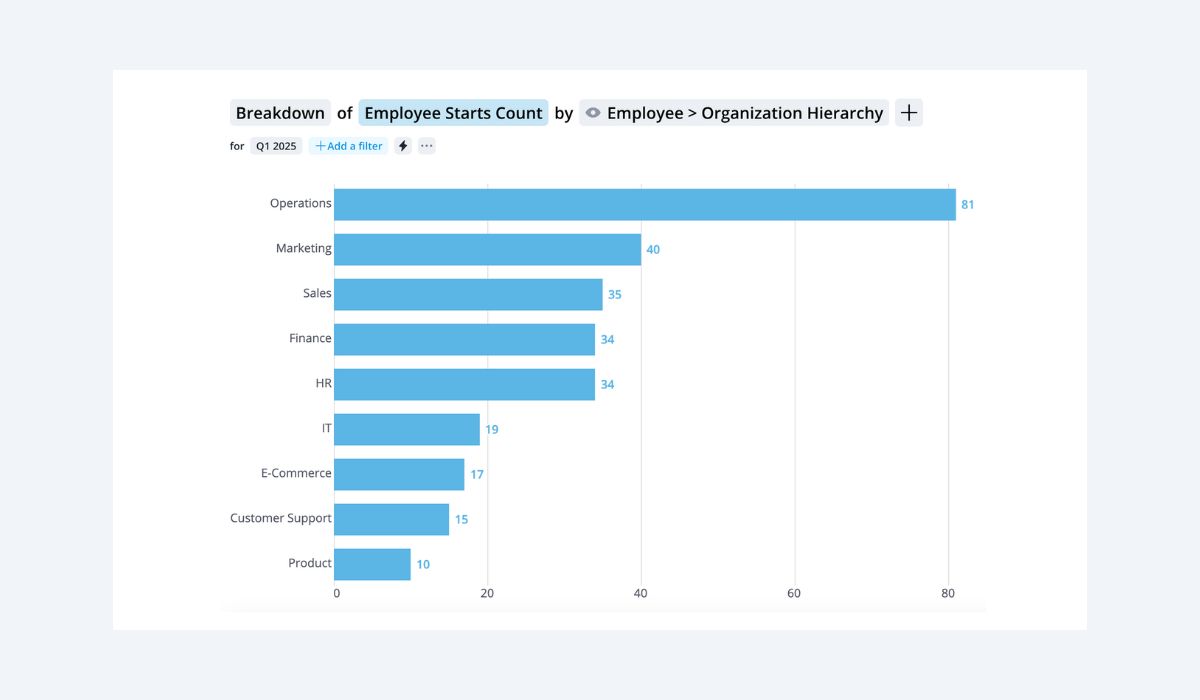
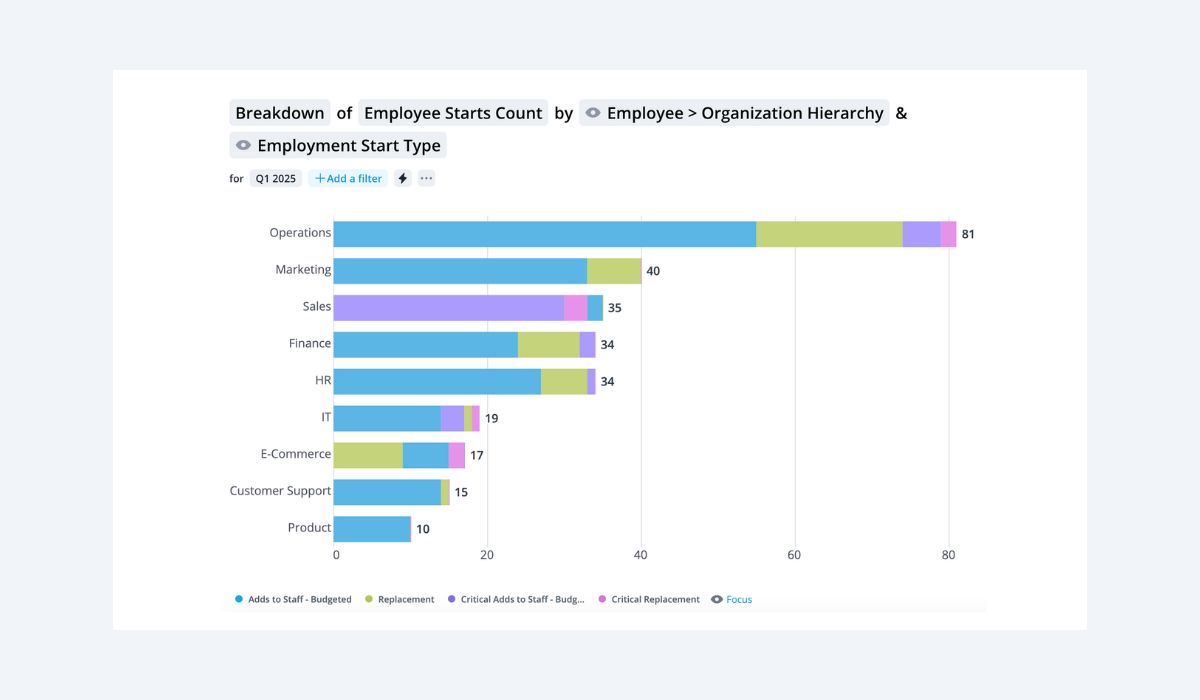
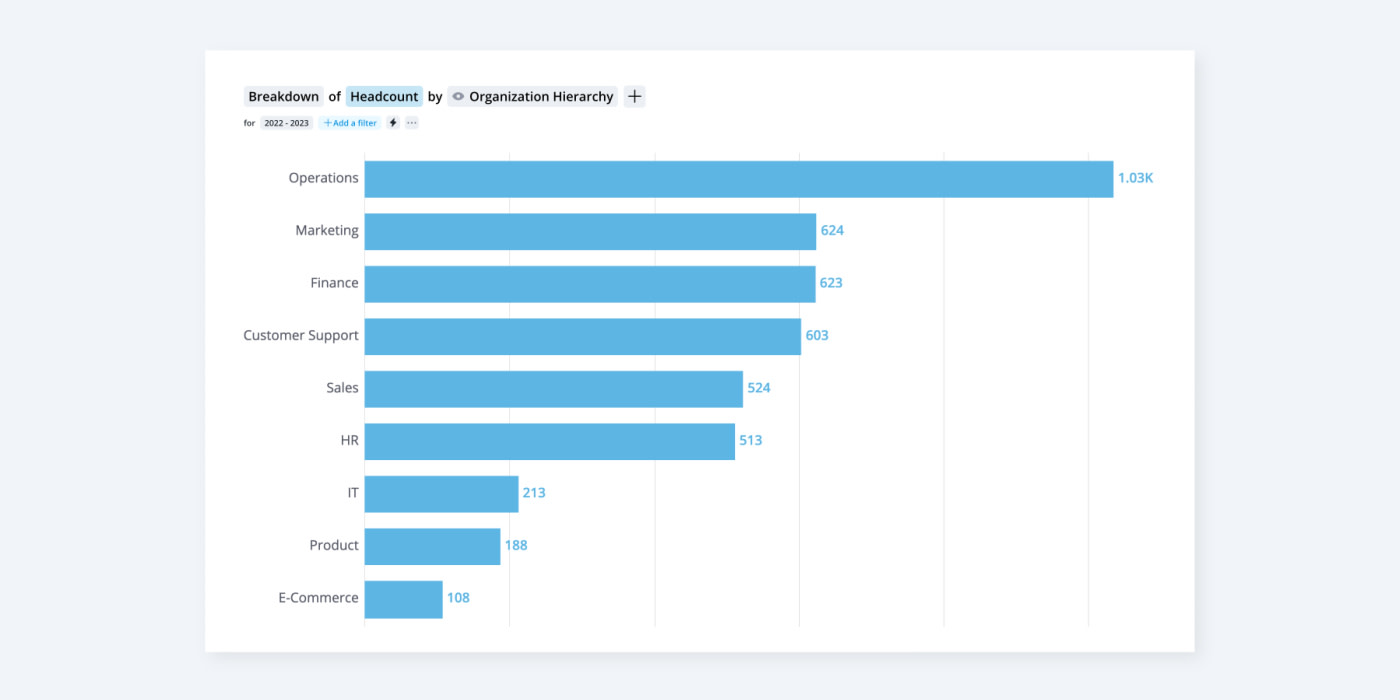
In addition, analytics encourage exploration, as well as the user’s natural inclination to see the results and ask themselves “I wonder what else there is?” The viewer can change or add filters to get new results in real time. In the image below, I added an additional metric of Employment Start Type and the results refreshed immediately.
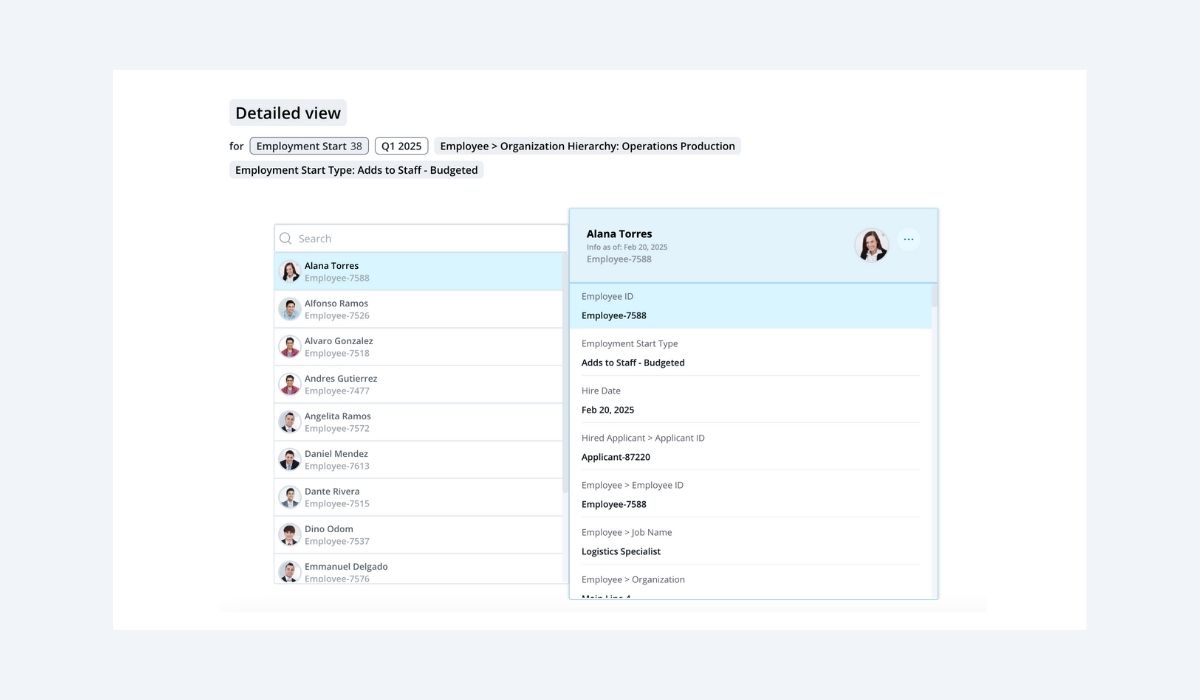
Again, because analytics is dynamic, the user has the ability to drill even further into the details (as seen in the image below).
The distinction between static columns in transactional systems and dynamic definitions in analytics systems remains relevant. However, with the rise of self-service analytics tools and advanced reporting features, many modern transactional systems now offer more flexibility.
These systems allow users to define columns, apply new filters, or pull in additional data without having to run a completely different report or create a custom one. This evolution makes it easier for users to generate insights without relying on IT or specialized reporting tools.
Siloed vs. unified
Very few businesses leverage a single system for every business transaction. More often than not, an enterprise solution is used to perform the core functions (such as an HCM for employee data, benefits, and payroll), with niche, best-of-breed solutions, such as an LMS, employee engagement tool, or Applicant Tracking System (ATS), used to manage other functions relating to the employee. This means that there are employee-related records in multiple solutions.
When data relating to a single object (such as an employee) resides in different solutions like this, the only way to look at that data side-by-side is to pull separate reports and then manually manipulate the files to create a single report. This becomes even more complex when organizations have multiples of the same solution (multiple payrolls, multiple HCMs, and more). It becomes nearly impossible to get something as simple as an accurate headcount number!
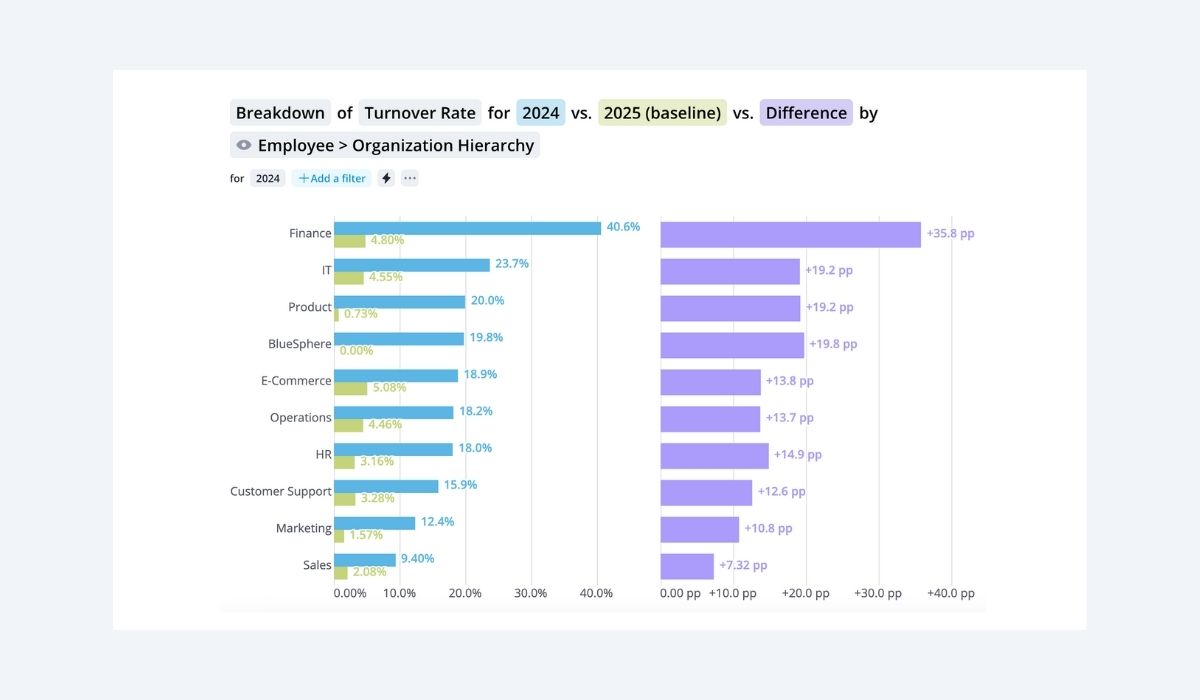
An analytic solution brings all the data together. When properly designed, it creates connections across all of your data points, giving you seamless, single-point access across your entire organization.
For example, it can be impossible to get measures on your quality of hire because your ATS can’t see what happens to the candidates once they’re hired and become employees. This is due to their employee data residing only in your HCM and other employee solutions.
But when you unify recruiting data with information from the rest of the employee lifecycle, you are able to follow the thread from the point of hire and beyond, and spot important trends that could impact employee retention, workforce productivity, engagement, and more.
As-is data versus transformed data
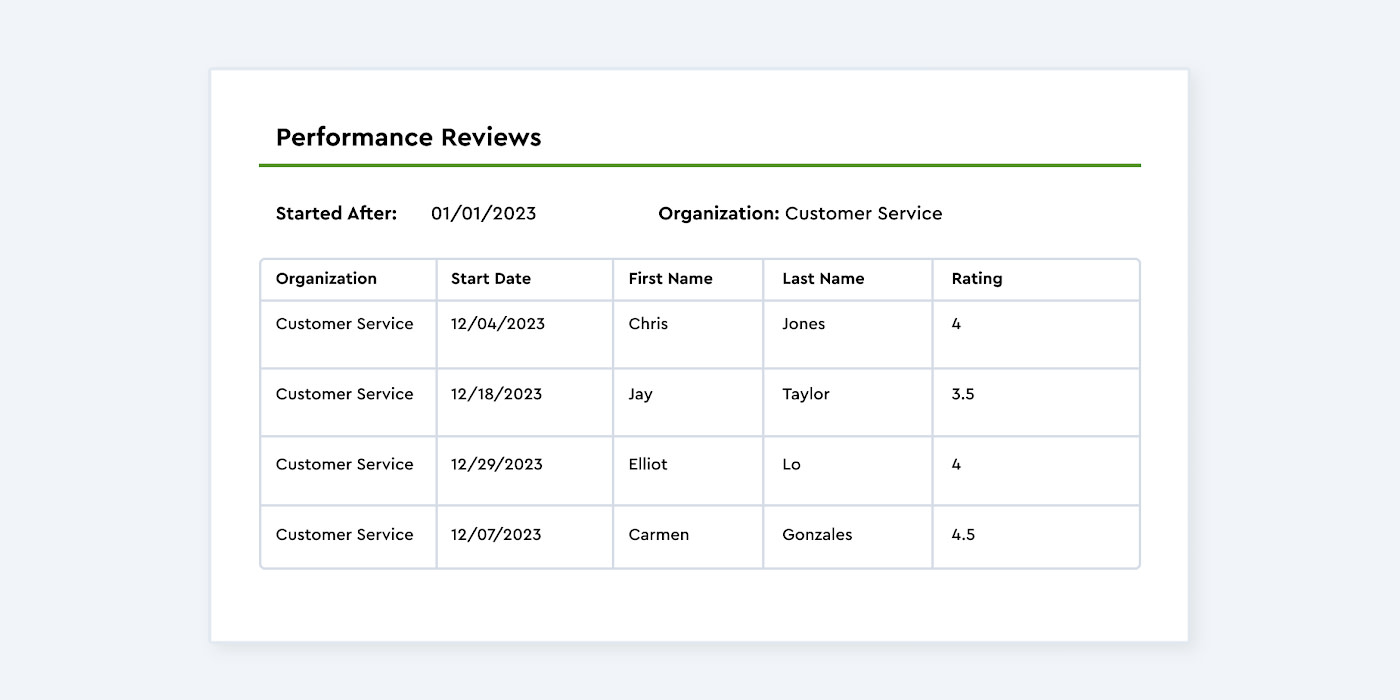
When you run a report against your transaction system, the data that is returned is exactly as it exists in that system’s database. These reports present a snapshot in time, which is great for giving you a read on what has happened up until today, exactly as it was captured. For example, How many people started? How many performance reviews were completed? How many people got 5s?
Analytics takes all this transaction data and boosts the value of the information so you can look at what has happened up until today, but also what could happen in the future. This is done by:
Transforming existing values
Deriving new values
Predicting future values
Let’s look at each of these in detail:
Transform
When transactional data is sent to an analytic solution, there is an opportunity to transform the data values that exist in the source system into new values, either to introduce standard values or to correct for common data-entry mistakes.
For example, an organization that has two solutions for performance–one using a 4-point rating scale and one with a 5-point scale–wouldn’t be able to look at performance across the organization in a meaningful way because top performers from the 4-point solution would just look like above average performers alongside the employees who got a 4 rating from the 5-point solution.
In order for the data to be combined or compared, transformation rules would be written and applied to the performance scores so that they are aligned on the same scale. So, to apply a 5-point scale across the board, the transformation rule turns a “4” from the 4-point solution into a “5” and a “3” would be transformed into a “3.75”
Derive
Once the data has been added to the analytic solution, the query engine (the mechanism that retrieves the correct data for the user, based on what analysis the user has chosen to look at) can derive new values from the existing metrics.
For example, an organization may choose to define the “Top Talent” metric to mean those employees with top performance scores, critical jobs, and a tenure longer than 5 years. The solution stores the data for performance scores, and critical jobs.
When the user chooses to look at an analysis that includes “Top Talent,” the query engine first calculates tenure (based on the stored Start Date). Then, it determines which employees meet the “Top Talent” qualifiers. This new metric is calculated in real-time each time the query is run, offering a more nuanced, value-added view of the performance data.
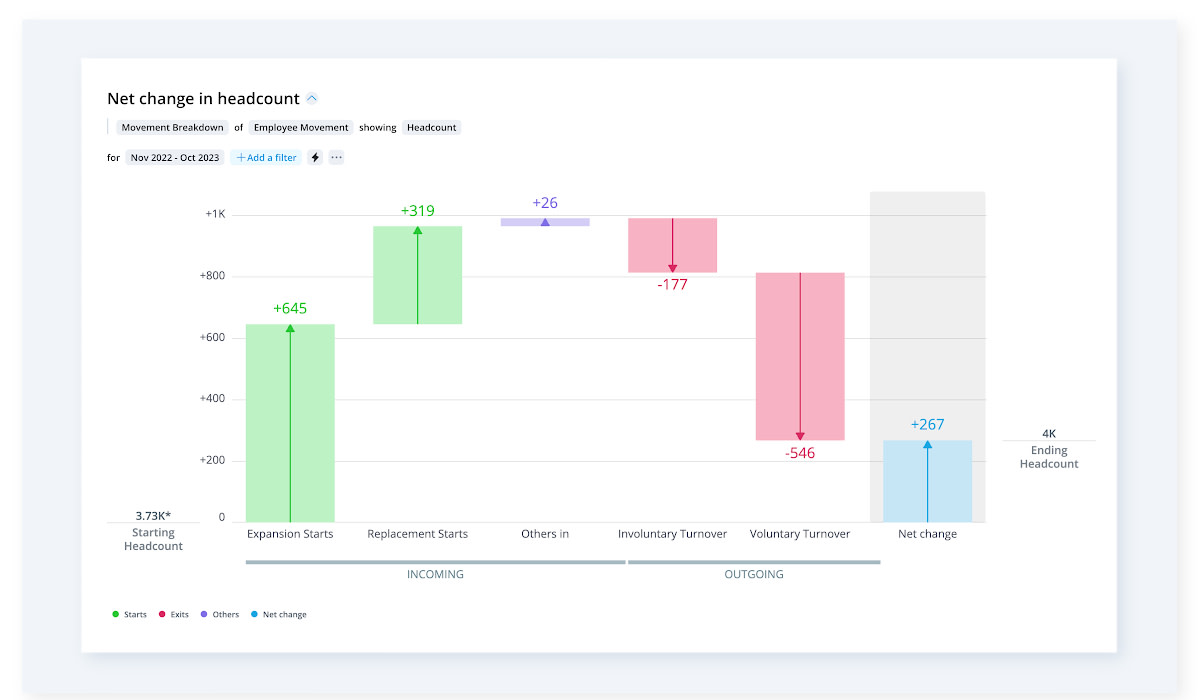
Movement breakdown chart showing employee movement of headcount
Predict
Powerful analytic query engines can also predict future actions based on the patterns of the past. Modern HR systems often leverage AI for predictive analytics, like forecasting turnover or identifying employee engagement trends. For example, Visier uses the random forest predictive methodology. By using such advanced models, your HR teams can make more informed, data-driven decisions to proactively address workforce challenges.
Insights lead to results
Insight is the deeper understanding you get about the actions and behavior behind all of the data points you’ve gathered. It is the ability to make out the big picture from the millions of brush strokes that created the painting.
Taken individually, an employee record tells you about one employee. A report on hundreds of employees tells you about hundreds of employees, but an analysis of all this employee data can illustrate the connection between new hire training and turnover.
The insight comes when you can see that employees who have participated in the new onboarding training have a lower rate of turnover; therefore, it may be worth expanding the pilot across the organization. With this insight, you can make the business case for the program to your leadership.
An analytic solution leverages all of the data created by your transaction systems so you can explore it from many different dimensions and get real insight into your organization. Because analytics connect data in a way that facilitates explorations and displays patterns and trends through visuals. The latter normalizes data to facilitate comparisons and derive new values that boost insight.
Sunstate Equipment’s success story highlights how advanced people analytics tools can uncover actionable insights that drive real business impact. The team used Visier’s people analytics platform to uncover actionable insights that drove a 50% reduction in turnover.
By analyzing workforce trends, Sunstate identified how staffing levels and overtime impacted equipment utilization and revenue. With Visier’s pre-built dashboards, HR professionals transformed their workflow, cutting time spent on data gathering from five days to just two minutes, allowing more focus on strategic initiatives.
Now equipped with clean, reliable data across the organization, Visier empowered leaders at all levels to make informed decisions. Key metrics were contextualized with industry benchmarks, offering meaningful insights to optimize operations and track progress. Aligning HR and Finance teams further meant Sunstate was now able to connect people metrics to financial outcomes.
Analytics remain without a doubt much more powerful business transformation tool than reports could ever be. Take your data-driven decision-making to the next level with Visier's Workforce AI Edge. Discover how it can enhance employee productivity, transform your workforce, and provide deeper insights into how people fuel business success.

