The Ultimate Big Data Cheat Sheet
What does "Big Data" really mean? What compounds the confusion is that Big Data projects may, in fact, not even be using especially large amounts of data.
One of my favorite Simpsons quotes is from Milhouse, who is playing Fallout Boy when he proclaims: “I’ve said ‘jiminy jillickers’ so many times, the words have lost all meaning.”
I suspect many have had a similar reaction to “Big Data” and found the words have lost all meaning. What does “Big Data” really mean? What on earth is Hadoop?
I’ve put together this cheat sheet to give you the lowdown on Big Data. So spend 10 minutes studying these points and ultimately, you will be able to sort out fact from fiction when it comes to this broad, and often misrepresented, technology concept. You will also get the scoop on what’s next: a major shift towards an emerging approach called Applied Big Data.
The Anatomy of Gartner’s Big Data Definition
What compounds the confusion around Big Data is that Big Data projects may, in fact, not even be using especially large amounts of data.To understand what it really means, a great place to start with is Gartner’s definition of the technology concept:
“Big data is high-volume, high-velocity and high-variety information assets that demand cost-effective, innovative forms of information processing for enhanced insight and decision making.”
Now, let’s deconstruct the key elements of this definition, starting with the first two parts:

Big data two parts
We’ll get to those forms of “information processing” in a moment, but first lets look at the three V’s.
Part 1: The Three V’s
Data qualifies as Big Data if it is retrieved via specific forms of information processing technologies AND has one or more of three different characteristics, known as the “3 V” model:
Volume: large, or rapidly increasing, amounts of data
Velocity: rapid response or movement of data in and out of the system
Variety: large differences in types or sources of data
Many people will stop there when defining Big Data, but to really understand how it works, we need to do a bit of a technical dive (I promise it will be fun).
Part 2: The Big Data Technologies
Big Data is generally composed of three technology layers:
First layer: Infrastructure to store and integrate data (bring disparate forms of data together) – Remember: Big Data may come in many varieties
Second layer: An analytics engine (think of it as a really powerful calculator) to process the data – High-volume and high-velocity data have driven the need for new types of analytics engines
Third layer: Visualization tools for users to explore and communicate information in an intuitive way
The first layer: infrastructure
If you have the need to analyze data, then you will invariably run into the challenge of working with data. Those who work with data have created their own language to describe the nature of this challenge: data is messy, in the wrong shape, or needs to be cleansed.
The era of Big Data began in the mid-2000s, when internet-based and social network firms started addressing the challenges associated with collecting and analyzing new kinds of information. The more complex the data, the larger the challenge, and therefore, Big Data required new approaches to be successful.
The fundamental challenge with traditional information processing approaches is that they require IT to go through all the hard work of storing and integrating data first. The first obvious consequence is that the ability to use the data to answer business questions is delayed until this work is done.
The larger consequence, however, is that the types of questions that can be answered are hard-wired into the structure of the data. If you have new questions, you have to redo difficult and expensive work. Modern Big Data approaches delay the processing work, and create significantly more agility to answer different business questions on-demand.
For the more technically inclined, here is a diversion into one of the major Big Data techniques that enables this agility: MapReduce.
What it is: MapReduce is a programming model for processing and generating large datasets. In 1998, the
had 26 million pages, and by 2000 the Google index had reached the one billion mark.
Back then, Google engineers had it rough: Large scale indexing of Web pages was tricky. To tackle this challenge, they developed the MapReduce framework (submitting a paper on the concept in 2004).
MapReduce is a framework that simplifies the work of splitting up work (Map) and then doing the work on each subset (Reduce). This gives programmers a lightweight way of doing things so that they can run in parallel on a lot of machines. (Like heads, 100 computers are better than one!)
The advantage for Big Data is that very intensive processing on large or complex data can be split into smaller work that can be done quickly. Additional computing hardware can be added, which allows splitting work into smaller units to enable processing ever larger and more complex data.
But keep in mind…Google brought this programming model to the mainstream, but the approaches that underpin MapReduce have been around since the early 60s. Myself and Ryan Wong, Visier’s CTO, were using a MapReduce approach when we created the business intelligence solutions in the 90s that powered the Crystal Decisions and BusinessObjects solutions.
The second layer: an analytics engine
While a technique like MapReduce can be powerful, it is not a panacea for the challenges of Big Data. Not all problems are applicable to a MapReduce technique, and in order for users to be able to navigate data intuitively there needs to be ways for questions to be formed. Let’s look at two analytical technology approaches: OLAP and In-Memory.
OLAP
What it is: Online analytical processing, which is an approach for asking and answering multi-dimensional analytical queries quickly. Multi-dimensional simply means that you can look at multiple attributes of data at the same time, such as the turnover of employees by role and performance rating. This allows relationships in data to be easily explored. But keep in mind…With OLAP, developers have to determine not just what data is needed, but what path the end users are going to take with it. Check out this “What is OLAP?” video for a great description,
In-Memory
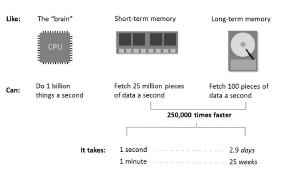
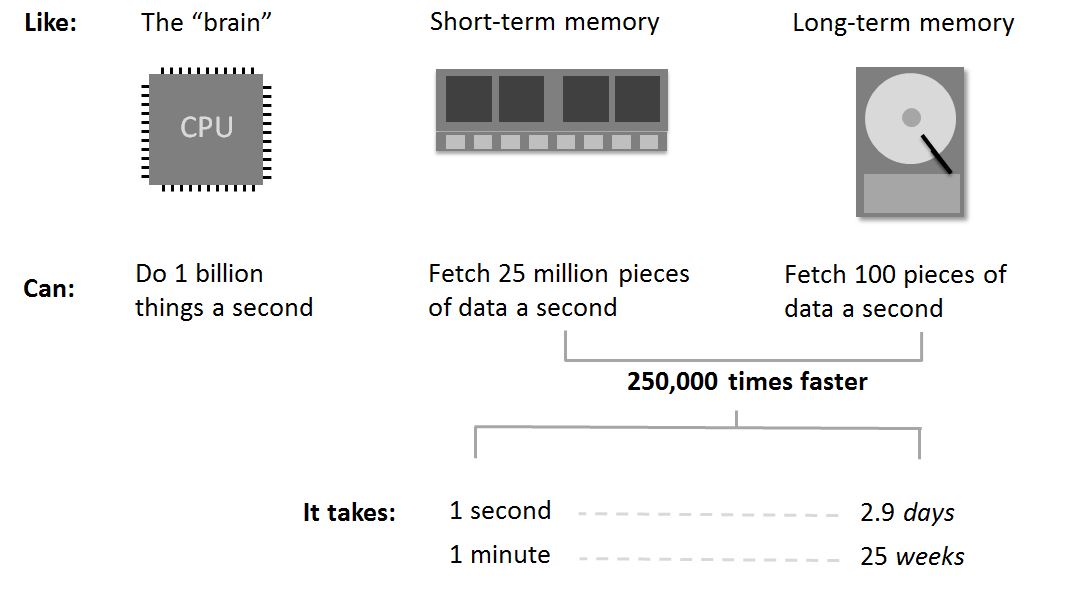
To understand in-memory analytics, let’s start by looking at the basics of where computers store and process information. Using the human brain as an analogy, the central processing unit (CPU) is where we do our thinking, computer memory is our short term memory, and the hard disk is like long term memory.
If you have ever run into an old friend and only remembered their name long after the conversation has ended, you understand why hard disks – computer long term memory – are a challenge to Big Data. To put the challenge in perspective:
The Ultimate Big Data Cheat Sheet
As you can see, in-memory is an approach to querying data when it resides in a computer’s random access memory (RAM), as opposed to querying data that is stored on hard disks.
This results in vastly shortened query response times (about 250,000 times faster), allowing business intelligence (BI) and analytic applications to support faster business decisions. You don’t have to let reports run overnight, and can construct questions and queries on the fly.
What about Hadoop?
What it is: An open source framework that implements many of the techniques mentioned above, including MapReduce. So, it is one solution for how to implement the techniques that have been created to solve the challenge of Big Data.
Yahoo! started using Hadoop in 2005 and released it as an open source project in 2007. Since then, there has been a lot of hype around Hadoop, with many vendors capitalizing on this technology approach
The third layer: visualization tools
Ultimately the tools and infrastructure I have written about above provide no value to organizations unless there are intuitive ways for users to access and use the information. This third layer is about the new approaches that have evolved to make information more intuitive to explore. These new approaches are often referred to as Data Discovery, which Gartner has described as “… a new end-user-driven approach to BI”. At the heart of these techniques are the ability to visualize information, and rapidly ask new questions of the information. However, they remain tools that leave a fundamental challenge: what are the right questions to ask of the data?
Part 3: The Reason Why We Need All This Technology
The third part to Gartner’s definition lays out the reason why we bother at all with Big Data in the first place, which is “to enhance decision making, insight discovery and process optimization.”
Achieving this goal is often the hardest part. As you can see from the tools listed above, traditionally, the market has been focused on making tools easy for the developer and IT professionals to build applications for the end user. Think of it in terms of home construction: you can either buy a house or build it yourself. The problem is, in the enterprise Big Data space, most vendors are selling tools to the contractors, but few are really selling directly to potential homebuyers.
So, how are we going to address this?
Part 4: What’s Next? Applied Big Data
Applied Big Data solutions are applications that are pre-built with with Big Data approaches that solve specific sets of business challenges. They are solutions — not tool sets — that work “out-of-the-box” and are provided directly to business users, rather than to IT. A true Applied Big Data solution does not require any programming or development on the customer’s part.
Current examples are Google Analytics, and — within the advertising and media space — a start-up, RocketFuel. (And, of course, Visier’s Applied Big Data solutions for workforce insights and action.)
With Applied Big Data, the three V’s and the “forms of information processing” fade into the background — you may never know that these apps have a framework like Hadoop under the covers, or use approaches like in-memory and MapReduce.
From the end user perspective, business users go from thinking about all this:

Big data full definition
To thinking about this:

Applied big data definition
The bottom line? Within a couple years, the Big Data talk with turn into Applied Big Data talk. Rather than focusing on the hype and technology behind Big Data, people will focus on what matters most: asking the right questions, getting answers, and making data-driven decisions.
Aren’t you glad you now know all about the technology that will soon underpin the majority of decisions you will be making?
