Why Cohort Analysis is Key to Effective D&I Programs
For effective diversity and inclusion programs, leaders need cohort analysis to see how populations of diverse groups at your organization change over time.

Often, the first instinct of a D&I lead is to bring in more bias training or special programs focused on the groups that may be affected. These generic activities tick the box to show action and investment, but increasing amounts of research show these don’t actually bring any meaningful change.
In fact, sometimes what looks like success isn’t success at all.
Why your D&I numbers stay the same
Here is a challenge that many of our people analytics prospects faced: despite making changes to improve diversity and inclusion, their overall diversity metrics had remained relatively stable.
How is this possible? Let’s say they see 25% of their population belonging to a minority ethnic group. As they start to breakdown this data into locations, job families, management / non-management or organizational levels, they start to see the wide range of difference that is contributing to that overall 25%.
Additionally, they review the rates at which diverse people are joining and leaving the organization. This highlights that the relatively stable overall score is being supported by a high volume of diverse incoming employees to offset a high volume of diverse outgoing employees. Therefore, the 25% score cannot be declared a success, since it is simply built on the ability to recycle diverse employees in large volumes.
To improve D&I, look at who’s still at your organization
With limited budgets and the need to show results rather than just activity, D&I leaders must use the best people analytics practices to focus their programs where they will bring the biggest change with the least time and investment.
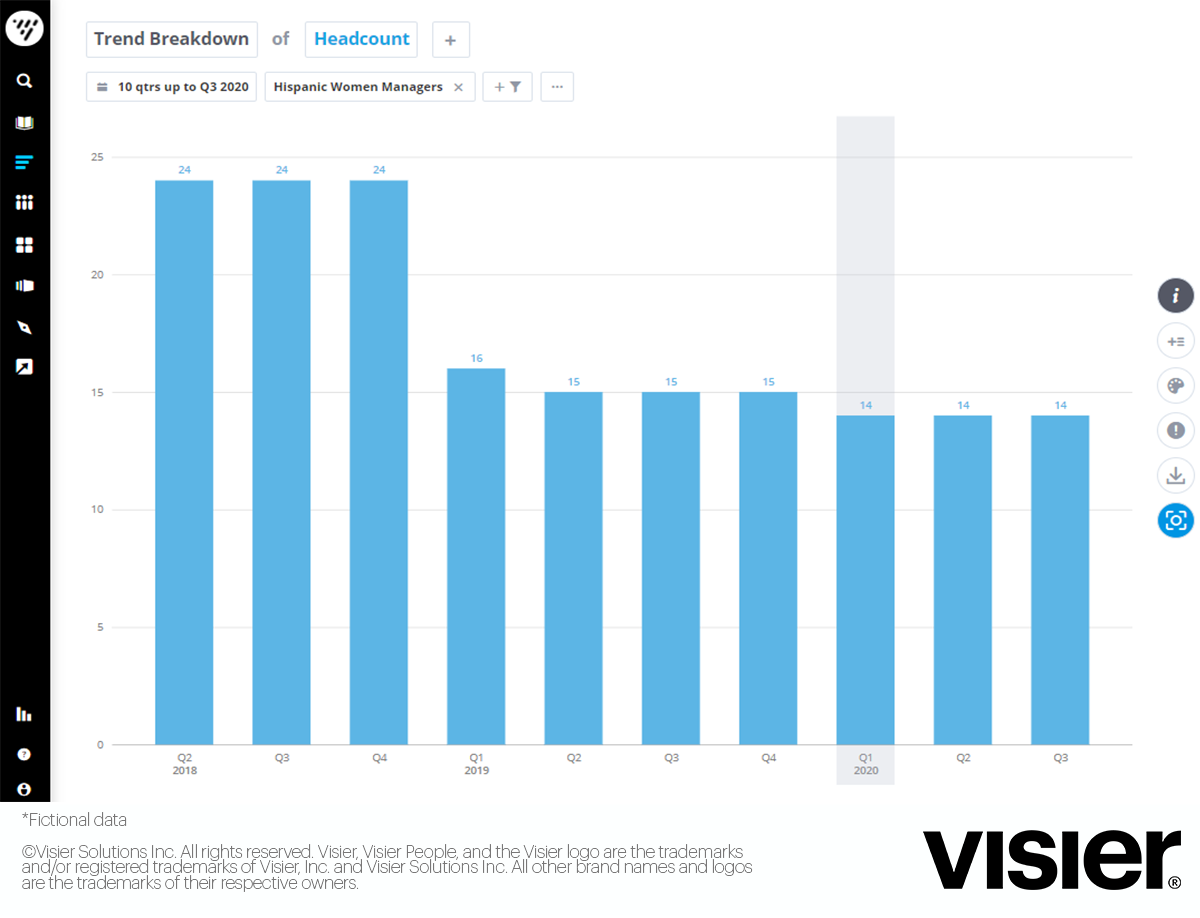
This is why, in our latest product release, we added the capability to lock a particular population to a specific point in time and analyze how this group is affected over time. This enables you to answer questions around survivorship, which is the term for members of certain cohorts that remain at your organization. For example, you can see how many Latino women, who became managers three years ago are still with the business. The number of people in the remaining cohort are those that “survived.”

This time-based cohort analysis is a critical feature for people analytics teams using Visier, as it opens up many powerful pieces of insights about your people, such as comparing the revenue results for salespeople who did and did not take training 12 months ago (something that L&D leaders have wanted to know for years!), and gives you the ability to drive the necessary changes to improve D&I at your organization.
Analyzing diversity measures, such as minority ratios by supervisor or promotion rates for female individual contributors, has been a core capability in the Visier platform for over six years. We are proud of the amount of change that has been achieved through the use of our application. A study to be released in October found that organizations who use Visier have substantially increased the rate at which women are moving into management roles.
These capabilities tied with time-based cohorts provide even more insight into the state of D&I at your organization. It allows you to dig deeper into your data to uncover the experience of your diverse populations over time.
Trend breakdown of Hispanic female managers that started together and how many remain at the company over time
How to do D&I-focused time-based cohort analysis
To ensure your D&I programs and changes make a real difference, you need to identify populations in key areas within the
business that will drive improvement, such as a group of diverse employees who have recently moved into management–then, most importantly, find out what happens to that population over time.

In Visier People, you can now easily answer this question by creating a cohort of diverse employees that first became managers, let’s say, three years ago. One thing you’ll want to look at is how many of that original population are still at your company. High survivorship is good, but low numbers means bringing more diverse employees into management is not driving the change that it should–actions need to be taken to ensure diverse managers stay longer.
You can do further analysis to see the performance distribution in this population: how much their compensation has increased relative to their non-diverse peers, or how their engagement scores compare to their peers. All of these additional analyses help build a clear picture of what is contributing to a positive or negative work experience for this group.
Remember: these analyses only provide insight when performed on the same cohort. Looking at these measures for a general population can mask the information you need because you don’t know how stable the population being analyzed is. Change could happen to individuals or it could happen because the individuals change.
D&I success is about more than one moment in time
By comparing a cohort to their peers or tracking different measures of experience over time it is possible to clearly understand what is happening, why it is happening, and what needs to be done to sustain or improve results. These are the insights that every head of D&I needs in order to build programs that can generate real change.
Visier’s commitment to enabling customers to build and sustain diverse and inclusive employee groups has been enduring. Through our benchmarks, alignment to EEOC data, wide-ranging sets of D&I-focused measures, and now, our time-based cohort features, we look forward to continuing to be an integral part of delivering positive change and creating more equitable workplaces.


