
DATA TO INSIGHTS
How Visier Turns Complex Source HR Data Into Meaningful Insights
The analytics tech ecosystem is always growing and evolving. This series guides technical stakeholders in organizations so they can better understand how easy it is to uplevel their data stack with Visier.
Start free trialTable of contents
What is Visier and what HR data challenges does it solve?Where does Visier fit into your HR data stack?How does Visier ingest data?Where is data managed in Visier?How does Visier bring together all of your HR and enterprise data?Extending beyond HR dataHow does Visier transform raw people data into actionable insights?Where is data stored in Visier?Visier lightens the workload for technical teamsIn this post, we’ll explain how Visier centralizes and transforms raw and complex people data into ready-to-use workforce insights at scale. We’ll share how you can blend in business data, such as sales or supply chain data, for a complete picture of the health of your business.
In a world of proliferating workforce data such as employee sentiment, performance, and talent management, it’s increasingly difficult for HR leaders to take action and for technical teams to keep up with ongoing report requests. With data in multiple systems, leaders lose out on the full power of their data in decision-making.
Despite the need to better understand an organization’s single biggest expense—their workforce, it’s not surprising that many organizations delay implementing a people analytics solution altogether due to their concerns about data quality. For example, all it takes is a company reorganization to end up with different values coded in each of their source systems—resulting in manual and often inaccurate reporting.
With today’s economic climate, companies can no longer wait to address this issue, as people data transparency and accessibility are vital to remain competitive and keep pace in the market. As such, there is a requirement for more nimble structures with high-level overviews that simultaneously enable deeper insights, so leaders can make changes at the speed of business. This is where Visier People® comes in.
What is Visier and what HR data challenges does it solve?
Visier is an end-to-end people data and analytics stack that efficiently enriches complex and raw HR data—helping you unlock insights without sacrificing security and governance controls. Our scalable platform securely delivers workforce and business insights to multiple stakeholders across your organization in seconds.
Trusted by over 40,000 organizations, Visier is purpose-built to handle the complexities of people data and offers both out-of-the-box and extensibility capabilities to enrich your existing data stack. Visier solves the last data mile problem, and offers a customizable people data model that has predefined metrics to deliver unparalleled time-to-value. Visier’s generative AI digital assistant, Vee, serves up intuitive, accessible workforce insights that empower people leaders to ask questions in plain language and receive answers within seconds.
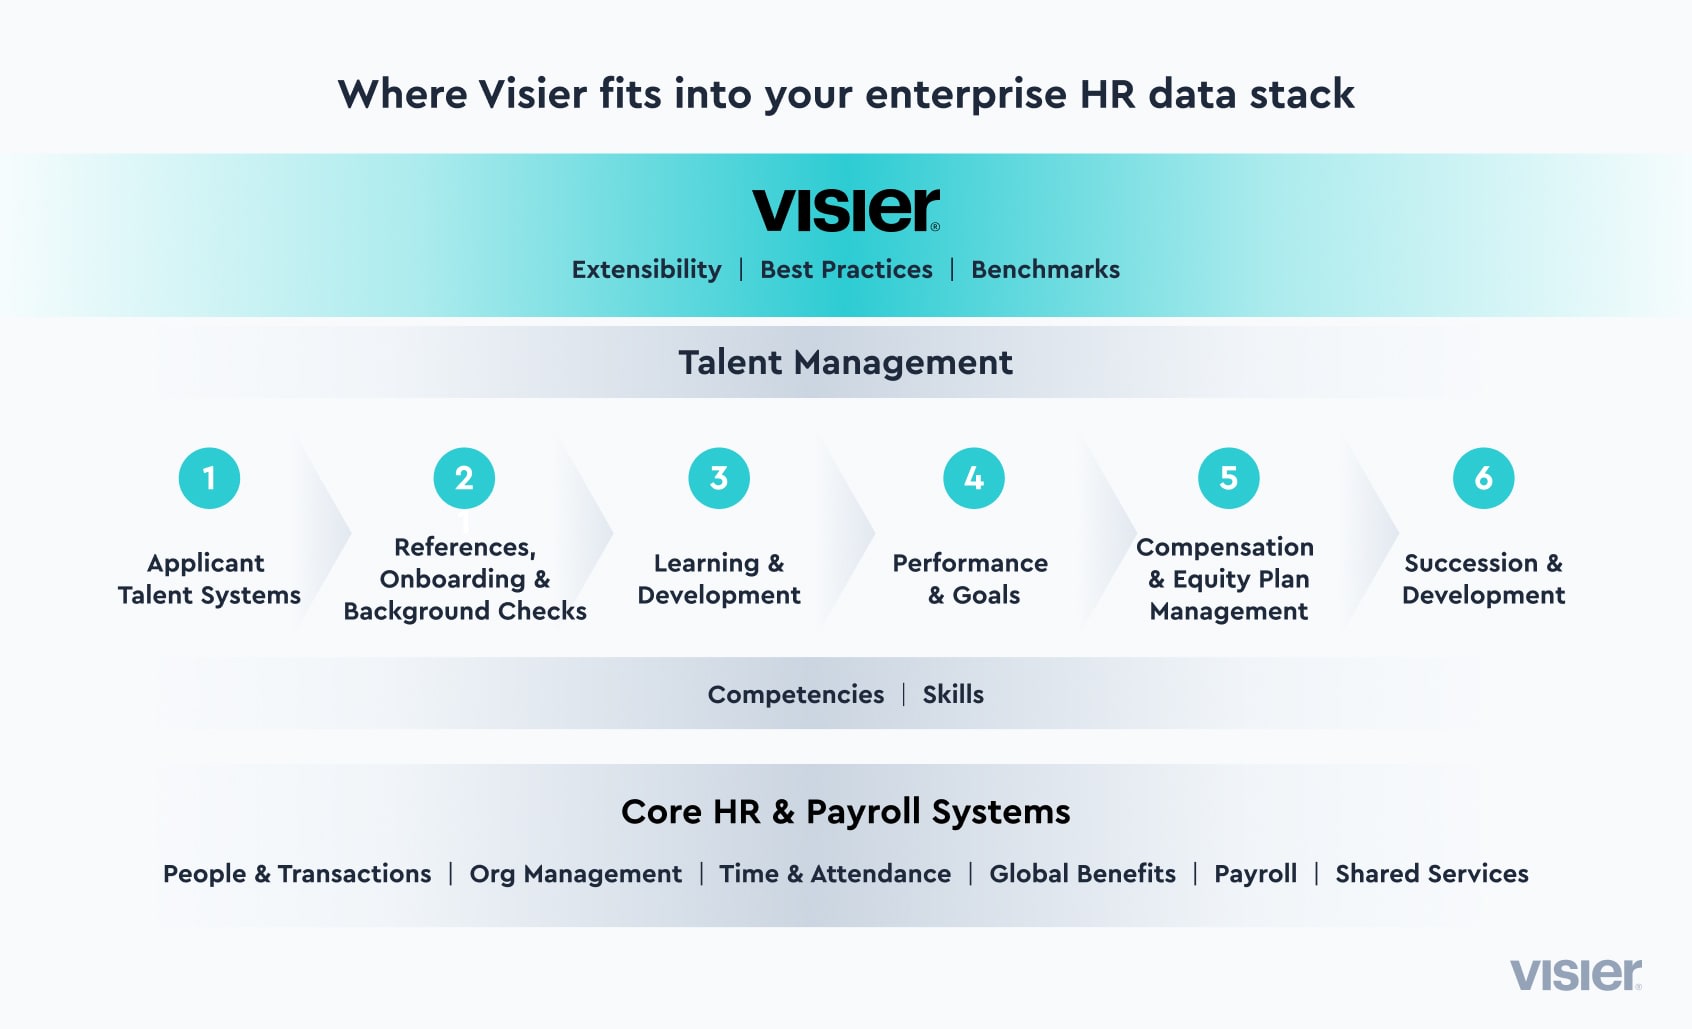
Where does Visier fit into your HR data stack?
Visier People serves as a semantic layer across your HR data stack and acts as a people data mart to provide a single source of truth. Some key differentiators of Visier include:
A highly extensible data model that helps augment your current analytics environment
Accurate benchmark data based on 18M employee records in 28 industries to enable leaders to better understand what "good" looks like
A wealth of best practices including ways analytic application developers can build better stories for the end user
The ability to blend business data to see the impact of workforce decisions on your business
Visier also offers guided analyses such as the ability to journalize your data and AI-driven predictions to better inform strategies and serve the needs of your business.
How does Visier ingest data?
Visier is unique in how it ingests, processes, and organizes data, largely due to Visier’s database structure and data intake structure. The data is stored in a columnar format with special processing for events. Combined, these allow for multiple benefits.
Visier's columnar structure allows massive data quantities to be processed quickly, ensuring that users using Visier’s UX or accessing data through an API or connector experience the fast application speeds expected today. This structure also makes it easy to add new types of data that are mapped to employees.
Our data ingestion logic automatically recognizes and maps data into an events-based format—this is very important for the subject of people. To understand events and trends pertaining to the workforce, users need the ability to see data of the present workforce, as well as across a period or from a specific point in the past. Visier ingests explicit time data points inherent in your dataset and can detect and map events.
Together, our columnar format and ingestion logic are friendly to messy and inconsistent data intake. This includes changes in data schemas, data uploads with varied levels of granularity, inconsistent upload cadences, conflicting data from multiple systems, and other common enterprise data challenges.
Visier’s database structure yields a single dataset that is easier to secure and maintain. Analysts and data engineers don’t need to construct a data mart for a specific time period to answer specific queries, for instance. Visier streamlines projects to allow for many different queries and initiatives to run off of the same singular dataset.
This structure provides flexibility for managing the people data of large, complex enterprises. Regardless of where your data resides, Visier can ingest data from any source or format. Plus, Visier enables you to blend workforce data (HRIS or talent data) with enterprise business information including sales, marketing, customer, supply chain, and finance data to make better-informed decisions. For example, one of our customers brings in all their POS data into Visier and ties that data to salespeople (mapped to the person’s ID) to assist in identifying which factors are driving higher performance. Visier models their data down to an individual receipt and connects the purchase to the sales individual.

Visier uses three key data acquisition strategies:
Pre-built data connectors: A programmatic pull with direct access to well-known sources such as Snowflake, Oracle Fusion, SAP SuccessFactors, and Workday via pre-built connectors. This helps resolve the complexity of source data and organizes it for analysis. Our pre-built connectors automatically map your HCM’s system data model to Visier’s data model, and templates allow for customization and changes in source systems.
APIs and import options: You can create a programmatic push by using APIs to feed data directly into Visier. You can also build your own data integrations, import bulk data, export, and query data from Visier People using multiple options.
Flat file uploads: You can use a flat file data integration to connect any data, no matter the size, volume, or source. With Visier, you can establish a data schema and push the files to it using an SFTP gateway or AWS S2 bucket.
Learn more about how to ingest people data, HR data, and business data into Visier here.
“One of the beautiful things about Visier is the system's able to pull in different data sources from all over. So we can pull in our talent acquisition data, our performance data, compensation, all of our HRIS data into one place…Leaders can go right to Visier and utilize either a pre-built analysis, or they can create their own analysis in the tool.”
-Elizabeth Bartels, Workforce Analyst, CommonSpirt Health
Where is data managed in Visier?
Visier’s built-in data management interface provides instant value by pinpointing data gaps, which helps you create a roadmap to improve data quality. To make data management easier, Visier People offers a studio environment where users can upload data via an SFTP, API, or flat file format as a recursive file.
With Visier, the data technology is incorporated into the analytics solution. This eliminates the need to have individuals with specific skill sets as the tool works on the same design paradigm for mapping and loading data. Data can be refreshed as frequently as you wish and with our pre-built connectors, you can pull in changed subjects only—known as delta loads—or a full snapshot between specified dates can be obtained.
How does Visier bring together all of your HR and enterprise data?
Visier offers administrators a built-in studio environment to ensure any data changes can be made without impacting production. Administrators can view changes like data loads or the extension of data without any user downtime or interruption—making it easier to incorporate new data at any time.
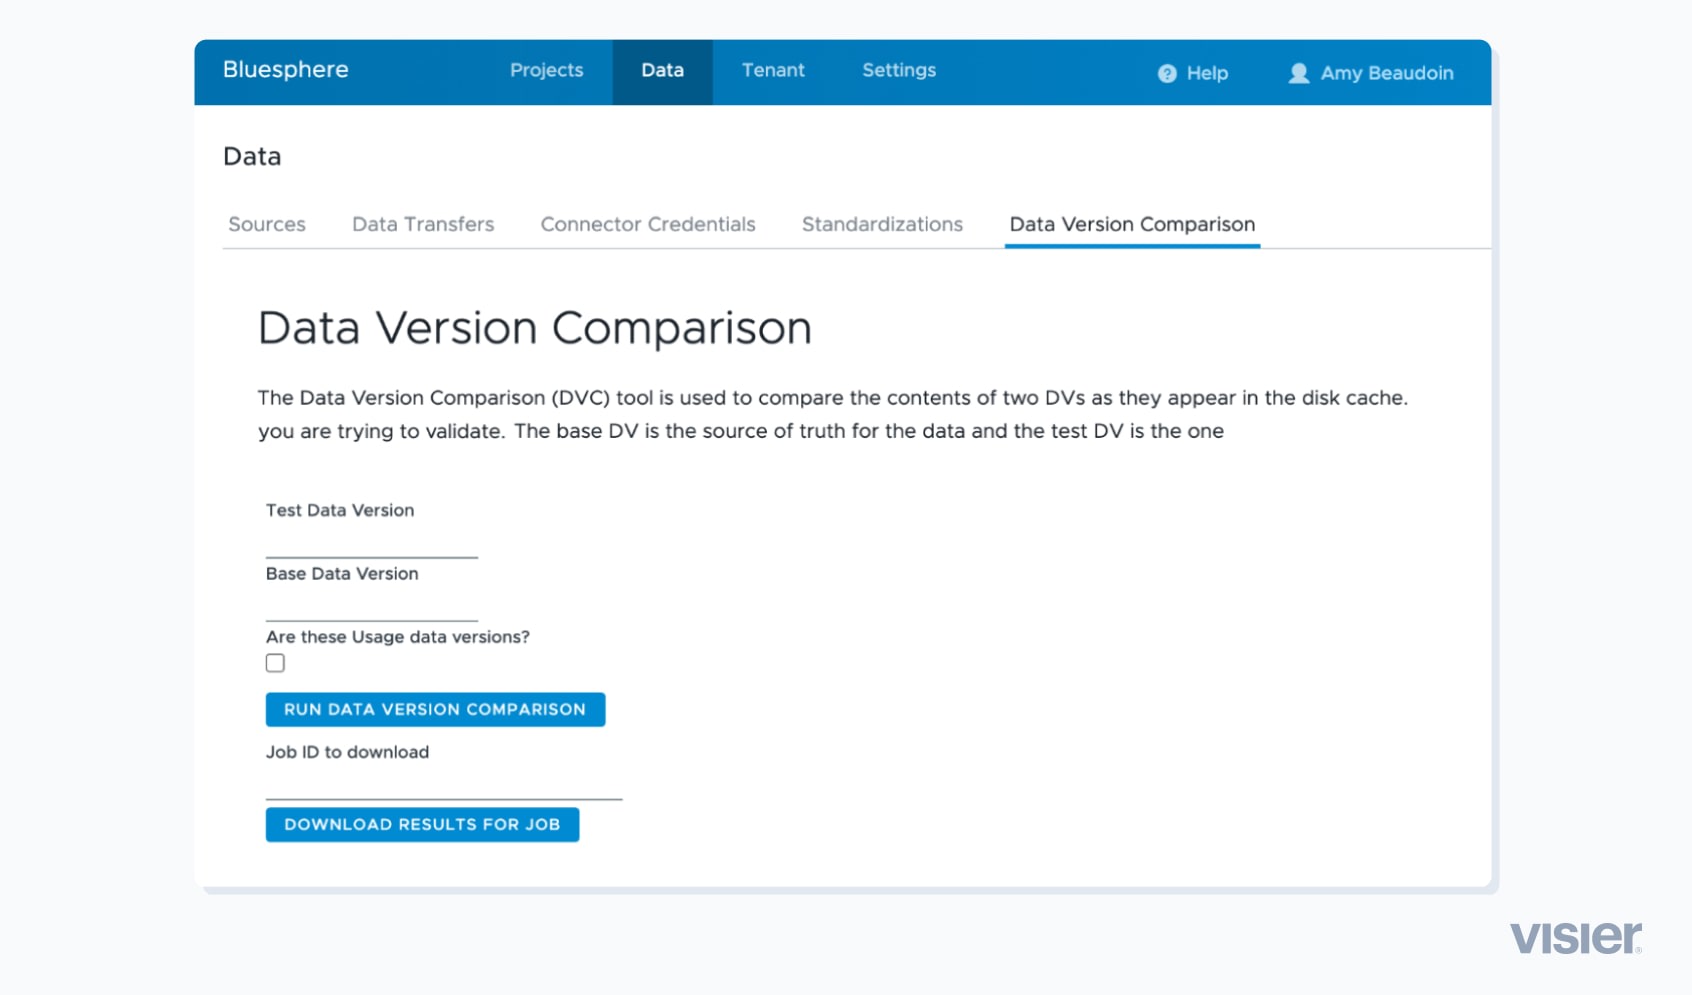
In Visier's Studio environment, you can pull up different data versions and switch back to view legacy data loads.
A Data Validation topic within the app management interface walks users through analyses to help quickly identify which data elements need cleaning and the values that can wait to be addressed or ignored. Each data element loaded into Visier receives its own analyses. Visier makes it easy to identify inconsistent values, misspelled or missing figures, and helps you understand if there are structural or logical problems with your data. You can also set alerts for specific events, like if data quality reaches certain thresholds, such as a 20% reduction in headcount.
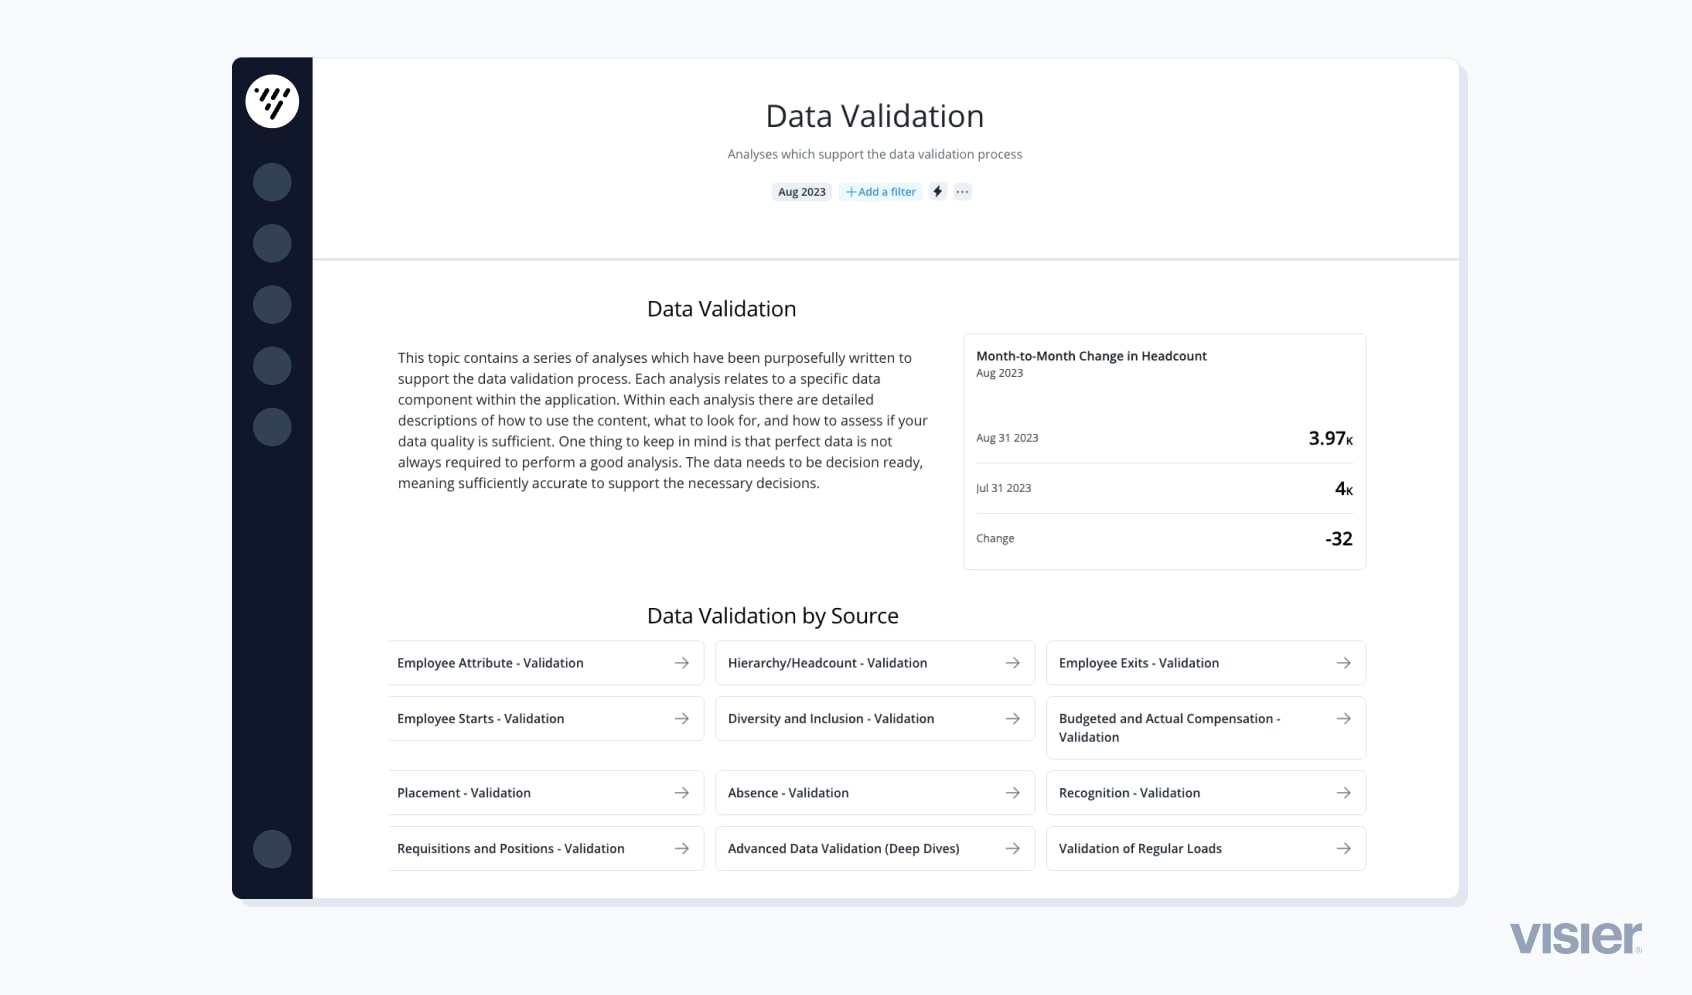
Visier has an automated process to standardize and normalize data across sources, and automatically maps all your HR and business data into our data model using our ETL (Extract, Transfer, and Load) process to read the files. Visier automatically removes, replaces, and/or re-categorizes duplicate records or missing values.
Data can be loaded into:
Subjects (e.g. employees)
Events (e.g. promotions)
Parent-child dimensions
Multi-value properties
Our platform consolidates historical source data into a logical view which is read by our analytics solution. Next, a flexible business rules application is used to conduct data transformations, aggregations, and synthesizing of data for corrections.
Our data-loading technology is specifically written to take into account the nature of data changing over time. Visier takes into account the relationship between subjects and events such as employees and requisitions. The original data files are stacked on top of each other to see if there is a material change, and our data mart manages the constantly evolving corrections of data to fill in critical data gaps automatically.
Here is an example of an employee’s performance rating at a point in time:
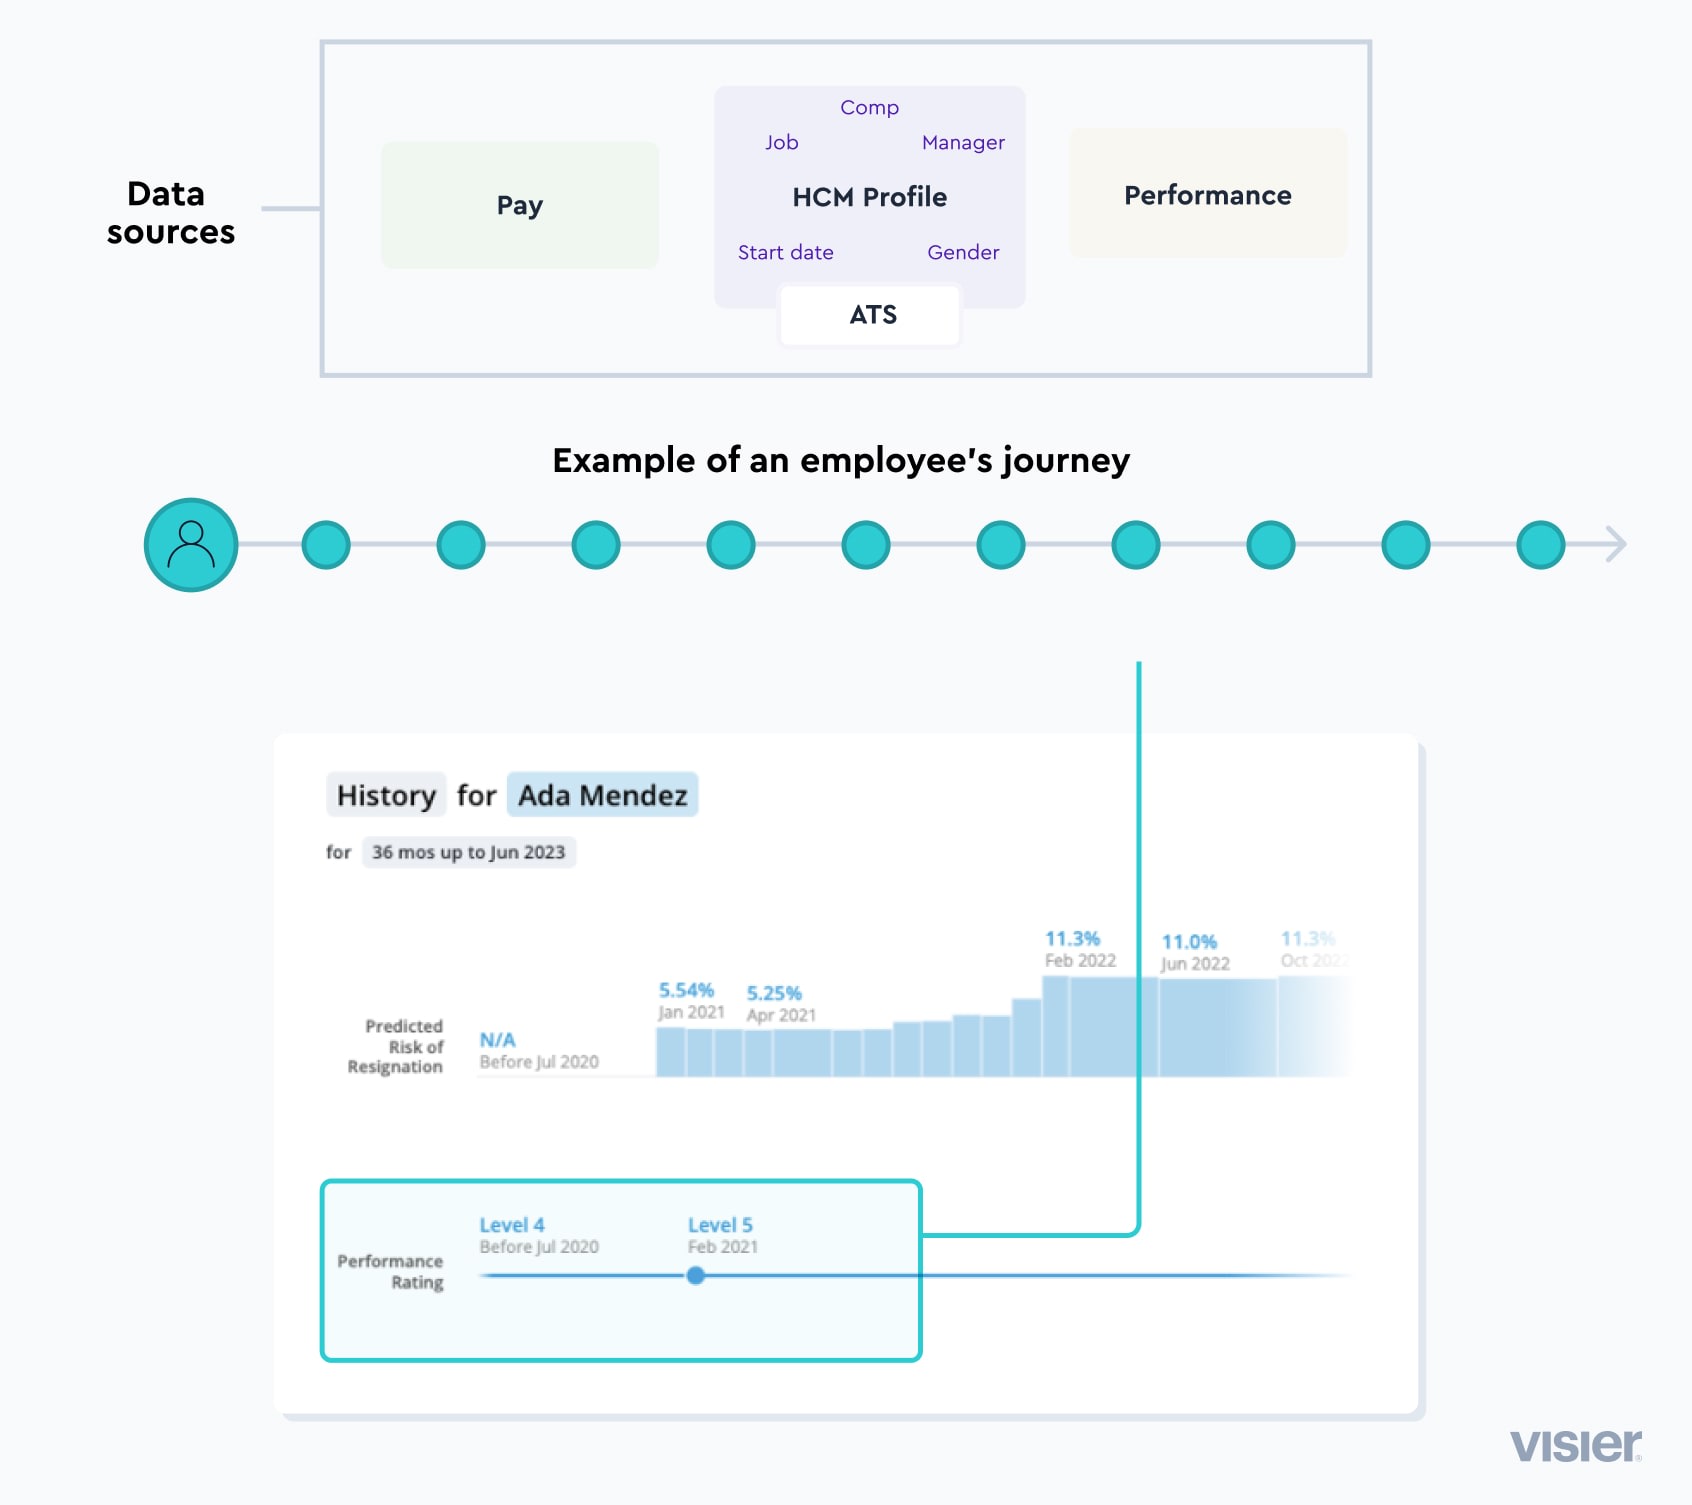
Visier enables diverse data analysis methods such as subject comparisons, property history, career journeys, and movement. Our platform consolidates values and data is bucketed into concepts, allowing for more efficient data cleansing and ensuring everything is put into the right file. Subjects and events are linked using a unique instance. For example, with employee turnover data (exits) which will contain involuntary or voluntary reason codes, our solution provides a standardized mechanism to show their resignation cause through abstraction. In this case, the entire model of involuntary is coded together whether it's for cause or performance.
Here is an example of reasons being rolled up under the resignation count:

Every analytic object in Visier’s data model is a table in the database with a many-to-one or one-to-many relationship with a subject in between. The employee lifecycle covers various events, and everything is about an instance or custom subject. Visier automatically factors in time as a dimension, allowing you to see progression over time. Visier will present you with a trend line that shows the sampling of the subject on different dates so you can verify if the data is correct or not.
“Visier takes all of our data from our different systems, transforms it—we don't have to clean that data—and then it's automatically visualized. When I hear about how other companies approach this when they've built their own, it sounds like way more headache for way less impact.”
Courtney McCafferty, HR Generalist, Protective Life
Visier cleans data using the following approaches:
Imputation and auto-generated records help to fill in data gaps.
Customize data groupings on the fly for end users.
The Flag and Fix mechanism is built into our data loading logic to correct data if source system corrections aren’t possible. Through our analytic application, Administrators can see what needs to be corrected and fix the data issue in the system of record. Once the issue is resolved, the Administrator can remove a fix so it’s not overwritten.
With validation analysis, during the load routine, Visier looks at the full span of your data through groupings, highlights the missing gap in the dimensional element, and labels it as “unknown.” For example, Visier assesses the employee record including the initial start date and termination, and will record if it’s still valid as it looks at the continuity of starts and exits. If the employee disappears without an exit or there are two exits and starts together for the same employee, the system will record this as a discrepancy that needs to be addressed.
Visier enables you to create your own:
Properties: Qualities of analytic objects that add additional detail to your data and are assigned to employees. For example, an employee's Job Name property correlates to one value that may change over time.
Metrics: A business concern that can be quantified as a number, such as Headcount. Metrics measure across your subjects or attributes, and you can calculate one or more values on your analytic object.
Concepts: Enable you to define and categorize information within your data. For example, a concept in Visier’s data model is Employee Movement.
Dimensions: Help you to organize unique values of an attribute into a list or a hierarchical structure for use as a filter or group-by in Visier. You can have multiple types of dimensions such as a leveled dimension, which could include Country, State, and City.
You can grow and add content as your business changes.
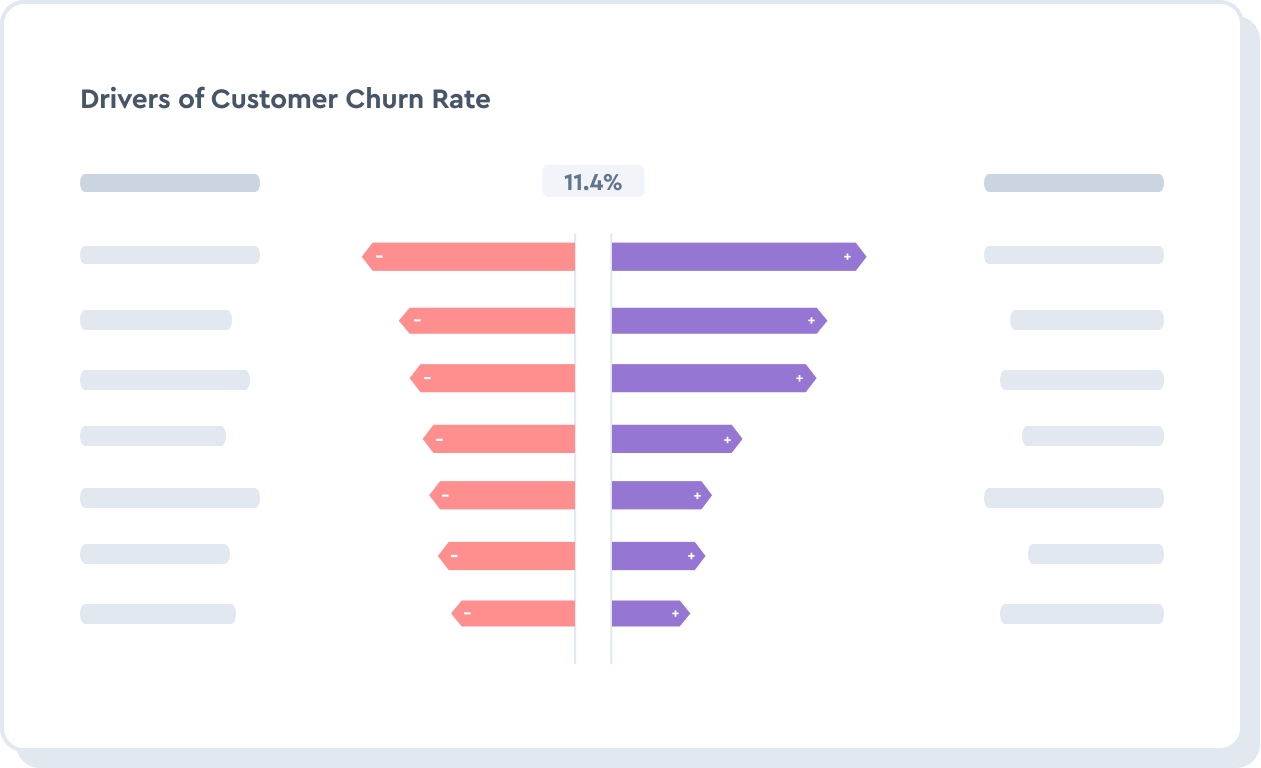
This data validation dashboard shows the drivers of customer churn rate.
Extending beyond HR data
Connecting to business outcomes and driving meaningful results requires incorporating other types of data. In the same way that we outlined creating new properties, metrics, concepts, and dimensions above, Visier’s data model can also be extended to map non-HR data. Common use cases include:
Incorporating productivity data to answer questions like "Which attributes are shared among successful teams?"
Leveraging revenue and cost data to understand how specific accounts and teams contribute to the bottom line
Visier Analytics for Jira, a live plug-in available in the Atlassian Marketplace, demonstrates how Jira data can be extracted and loaded into Visier to give better insight into productivity. An organization that wants to do the same with project management software can create new objects in the model for projects, time estimated, time spent, status, tasks, subtasks, and more. This functionality provides the ability to report on things like the impact of retention risk on key projects, the effectiveness of onboarding to productivity, and the impact of seasonal cycles on productivity to better forecast capacity. There’s even granularity into the performance of specific teammates with 360º individual reporting.
As long as the data connects to people and the workforce, organizations can layer operational data on top of their employee data to better understand the impact that people have on the growth of a business.
How does Visier transform raw people data into actionable insights?
A big barrier to analytics success is that traditional analytics solutions don’t help answer the why behind the what. A recent Forrester survey revealed that 68% of organizations claim they may have the data they need; however, they don’t know how to move beyond data collection to analyzing it to generate actionable insights. And, despite having robust tech stacks dedicated to collecting workforce data, 71% of organizations admit they are unable to extract the insights they need to make better decisions.
68% of organizations claim they may have the data they need, but they don’t know how to move beyond data collection to analyzing it to generate actionable insights.
Within the studio environment, incoming data is loaded into Visier's event-based analytic data model and allows you to define and organize data by subjects such as employees. It creates an event stream for each one of the subjects with a recorded data stamp.
For example, a hire date is linked to a manager’s ID and a person’s ID is also the employee subject. You can view the event stream at any point in time such as looking at all employees in January 2023, grouped by their job. A special subject type goes with a specific entity. You can define as many as you need (e.g. company as a subject and record sales events). There are properties associated with the subjects to enable you to track for annotation purposes and to create dimensions (e.g. collections of similar values that can be grouped or sliced and diced by subject).
Visier highlights insights that are relevant and builds tracks for users to follow. With the Explorer tool, users can create and apply filters like employee sentiment for locations they focus on. The Explorer tool gives directions on how to group information and enables users to choose filters and take a snapshot of the data. Users can also leverage pre-defined metrics and assemble their own stories through the data.
Visier infers relationships between tables, building an extensible and customizable analytical model that will grow with your specific business needs. The design of our model enables a self-serve exploration experience on the front end that includes filtering, drill-downs into more details, and reorganizing data. Our data schema includes objects (HR areas) for all data associated with people. All data is processed in memory and organized for analytics. The platform includes people-specific workflows and visualizations that take the power of our analytic model and make insights consumable for the user.
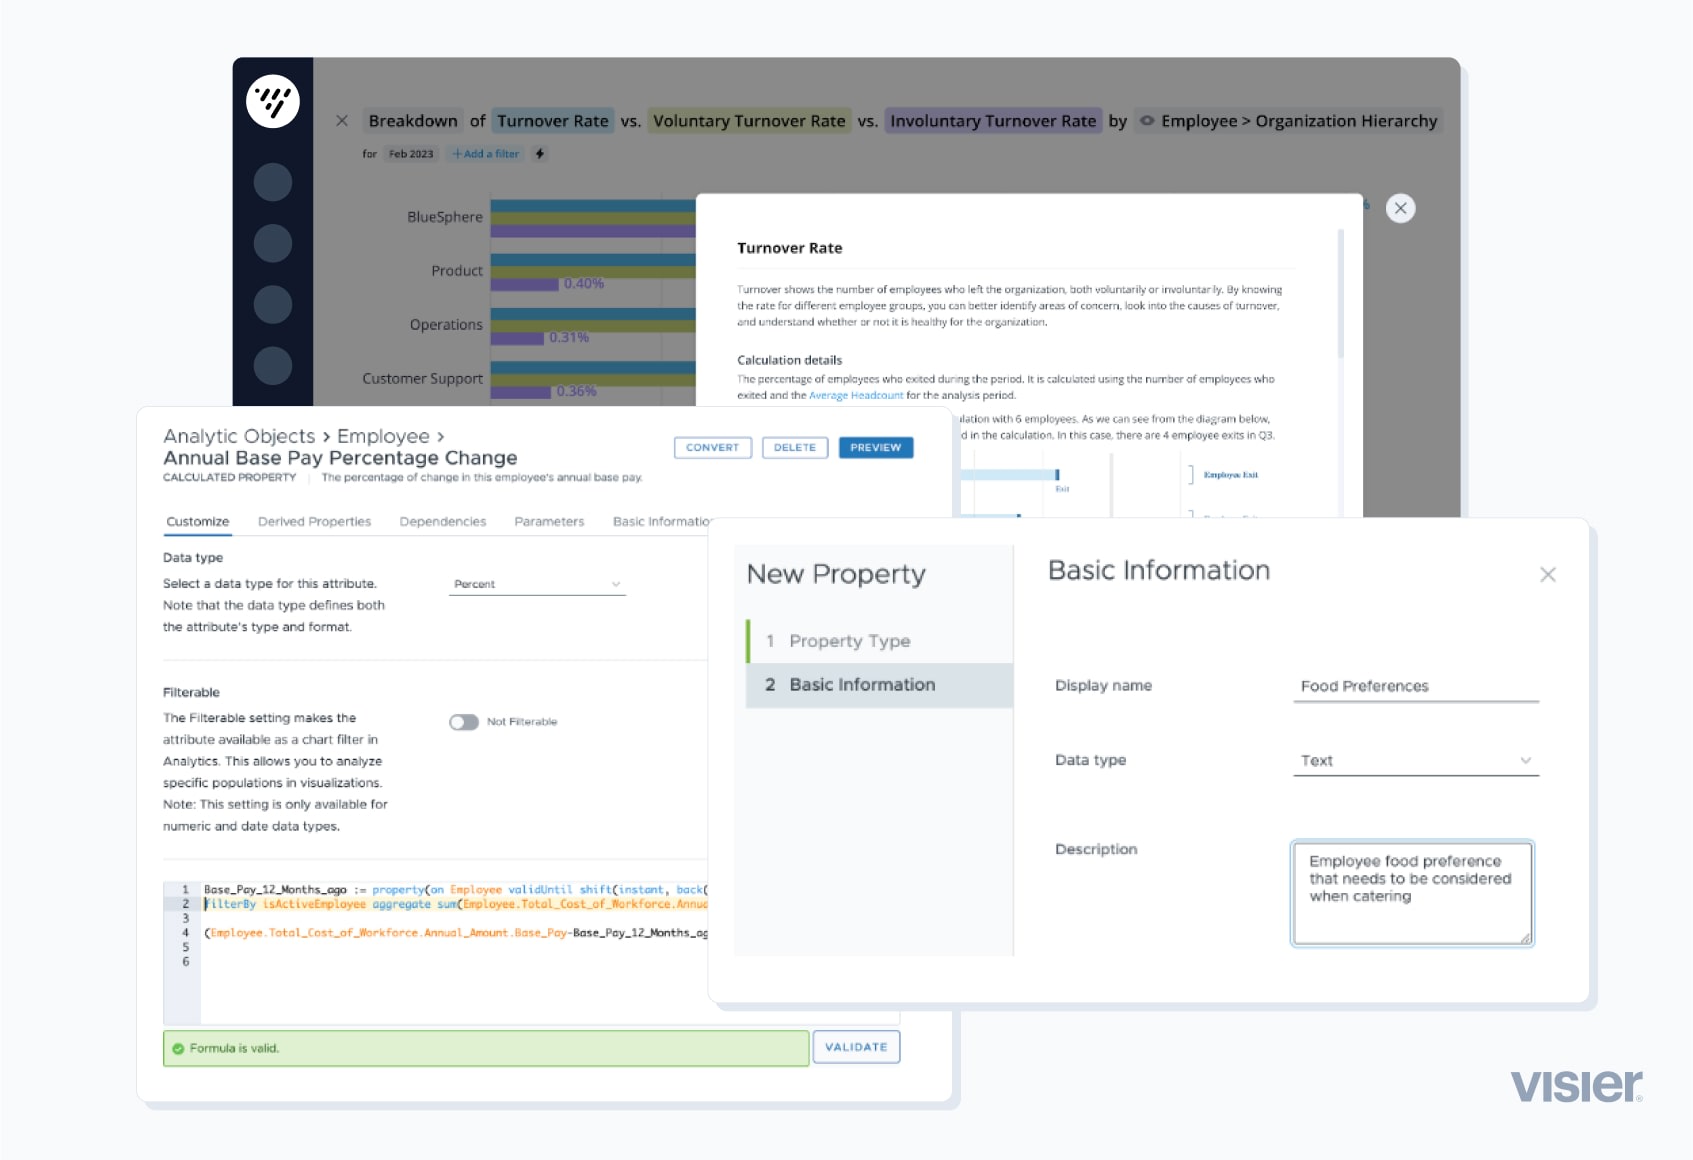
Visier's studio environment gives administrators the ability to make and validate data changes like creating custom analytic objects, new properties, and more.
Where is data stored in Visier?
When data is ingested into Visier, it’s stored in sources. For example, Employee data is stored in the Employee source, and every time a new Employee data file is sent to Visier, it’s added to the Employee source. Our source represents a staging view that contains an aggregation of all of your historical source files including daily employee snapshots.
Visier lightens the workload for technical teams
Regardless of where your people data is housed—whether in multiple HRIS systems, data repositories, or spreadsheets—Visier has the flexibility to ingest any data source, highlight any discrepancies for faster cleansing and harmonization, and scale insights downstream to users within seconds. Visier helps you act on your people data faster than building on your own.
Our platform provides a flexible data intake process to enable you to rapidly adapt to the constant flux of technology and business changes without any user downtime or disruption. And, our proven connectors and APIs ensure your people data and insights are always up-to-date.
Visier’s easy-to-use lifecycle management interface is delivered as a cloud solution and accelerates existing people analytics workloads, and allows for easy ingestion, extraction and cleansing of data.
Want to learn more? Get a demo and let’s talk about how to maximize your analytic data tech stack with Visier People.

