Spring 2024
What’s New at Visier
Discover our latest features and capabilities that help you make people decisions with greater clarity.
Special announcement
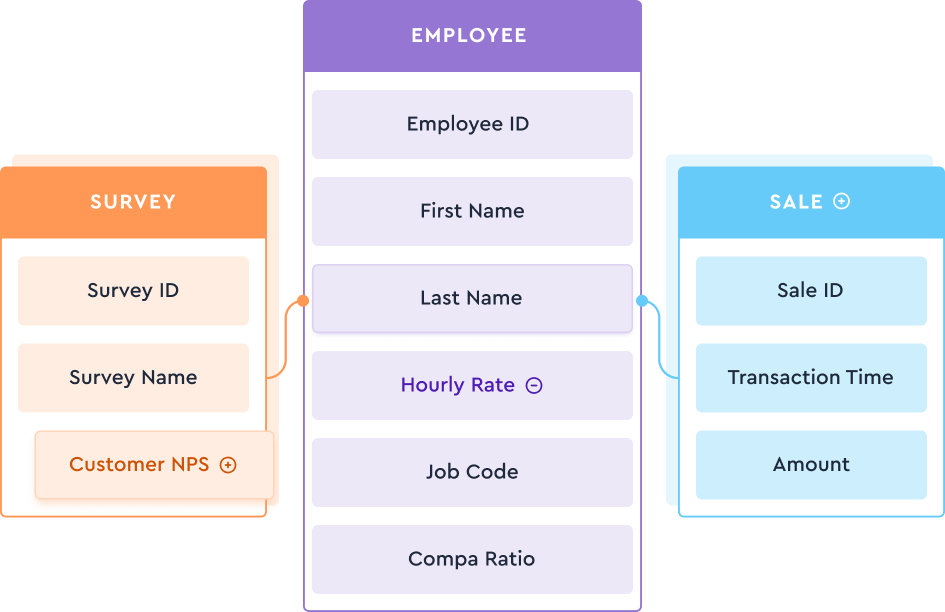
Visier People® Extend: Your business, your data, your model
We are excited to announce that we’ve added new Studio capabilities to make it easy to:
- Customize your analytic model. Customize your Visier analytical model to make it your own. For example, exclude contingent workers from headcount or add language proficiency to your employee records.
- Load data into your analytic model. Load HR data into your Visier analytical model, allowing you to unlock insights at your own pace. For example, load your TA data into your purchased Talent Acquisition content.
- Extend your analytic model. Understand the impact of people on the business by bringing in business and HR-adjacent data. For example, see if your upskilling initiatives impact revenue or if remote work impacts developer productivity.

Key updates in this release
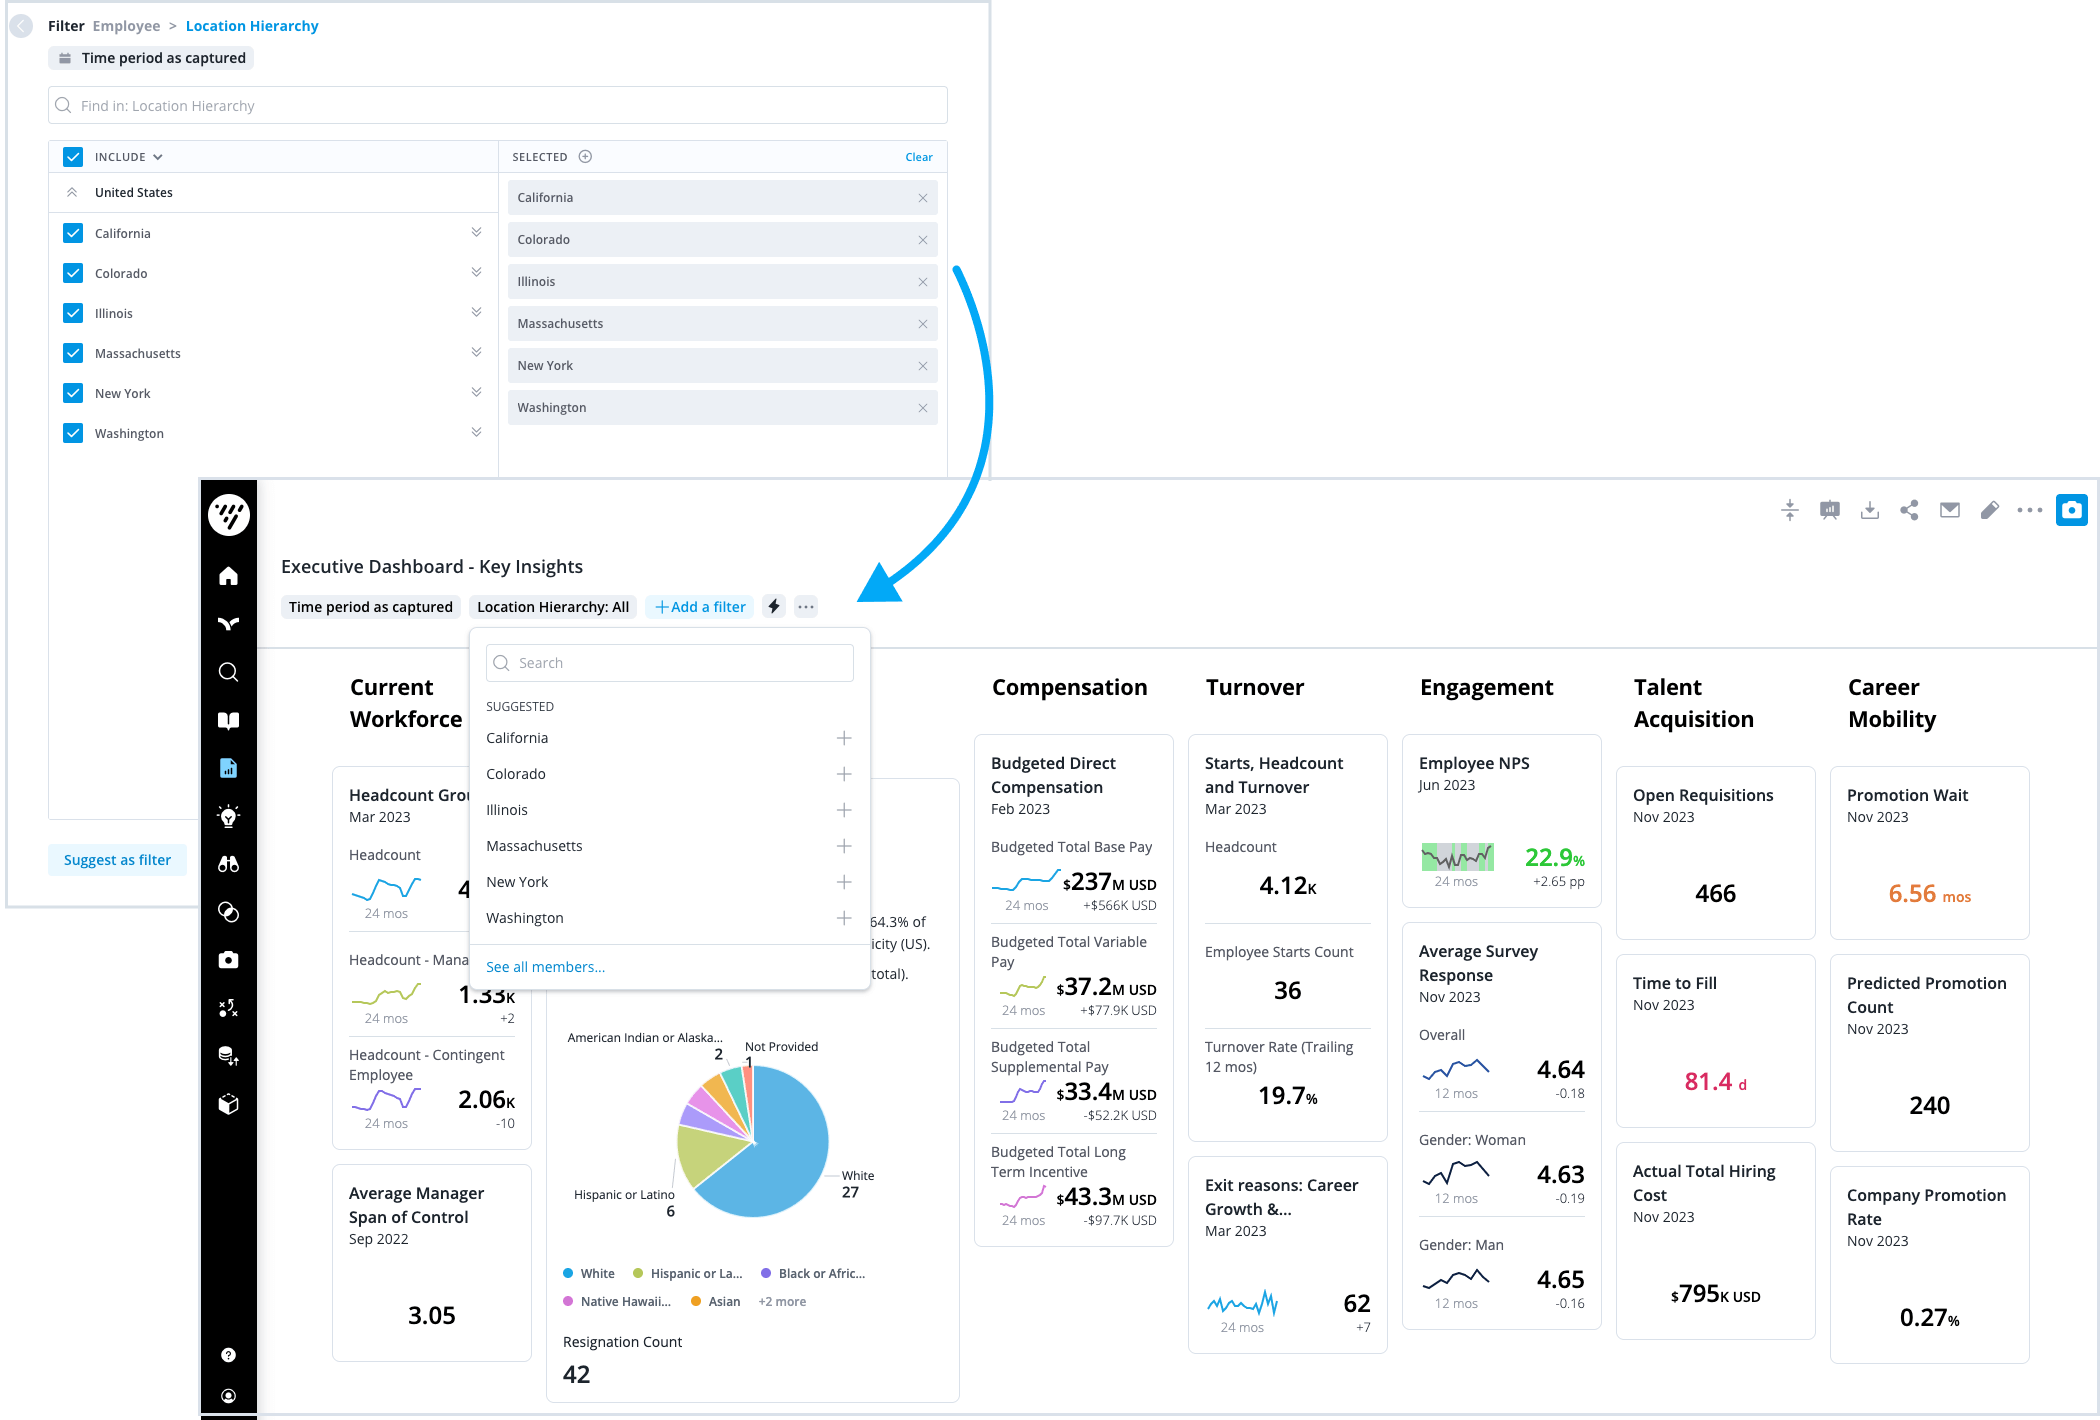
Suggested filters
Knowing how to filter a dashboard to get the best insights can be overwhelming for your users. Suggested filters make this experience easier and more intuitive. It also enables authors to guide their users by suggesting which filters to choose. How? Authors can highlight the most relevant subset of values within a dimension, creating predetermined filters for their particular analyses. For example, authors can suggest geographic dimensions in a visual so readers can filter (or not) the results per region.

Updates to Visier’s Job Taxonomy and Benchmarks
Visier’s skills taxonomy keeps getting more robust. The Spring release introduces industry-skilled jobs for Product Managers and Tech Writers and improves the consistency of labeling in a wide variety of jobs. Benchmarks will also be refreshed based on our most current data.
Visier People Workforce Planning: Updates on Headcount and Cost Model
Attention Workforce Planning customers! Say goodbye to the hard-coded legacy model and welcome our fully customizable Headcount and Cost Planning model to the Visier Blueprint. This new feature allows you to add inputs, plan items, adjust calculations, and other tailor-made choices. Additionally, it supports Managed Plans, introduced in the previous release, enabling users to create plans managed in Studio.
Data version validation (a.k.a. Alerts)
This feature allows you to set alerts for any attribute, metric, and user group. This means that whenever a new data version is created, the system checks it against your preset alerts. If any of the values are outside your expected range, the system will generate alerts for you. You can automatically bypass the issues or stop the DV from being published for critical issues.
New data science workbench support: Jupyter & Sagemaker
Visier has just released new documentation to help guide your Data Science team in authoring their prediction models and writing the predictions back to Visier People for consumption by your employees. See the detailed instructions for Amazon Sagemaker and Jupyter Notebooks here.
Display count and % labels in visuals
The spring release offers new display options in Breakdown and Trend Breakdown charts. Users can now show counts, percentages, or both in these visuals, improving data comprehension by easily displaying both labels simultaneously. In addition, you’ll be able to display options for primary and secondary dimensions separately, giving you more options for presenting the data.


